(Note for mobile device users: This article is best read in widescreen; therefore, please read in landscape mode. Also, in the web version, instead of clicking images to zoom, regular pinch-zooming would work better. In the mobile version, click-zooming would be fine.)
How many times have you been told by the BJP and its partners-in-propaganda that the UPA has destroyed the economy in the last ten years...? Vajpayee ji's "vision", we're told, had created a "land of milk and honey", which the UPA squandered by indulging in its policies of "dole and giveaways". Now, there is apparently no other way but to submit to the superpowers of a Chappan-Inch Man (man of fifty-six inch chest!), to rescue the economy.
Much in the same way, one'd suppose, as he rescued 15000 people trapped in the Uttarakhand floods in just one Sunday afternoon (watch video below), with 80 Innova cars, and 4 Boeing Jets, putting to shame our armed forces which struggled for two fortnights to do the same thing in perilous terrain, with mounting losses of equipment (a rescue helicopter crashed) and personnel...! But those rescued were all Gujaratis (wonder how he figured out and picked only the Gujaratis among disaster victims...) -- so if you weren't one, tough luck. Choose you birth-state more judiciously, next time.
And read here and here how this miracle rescue act can be pulled off...! Several days later BJP President Rajnath Singh clarified that Modi ji himself never claimed to have rescued 15000 Gujaratis. But, a man who tweets by the hour, never got time to let the people know that it was all hoax, while it ran on television for days on end. Perhaps he had some problem with his cellular network provider, that prevented him from tweeting his hands off this. After all, a modest man like Modi ji never believes in making false claims himself. How the story was planted is reported here.
Anyway, let's us get back to economics now, and see what the BJP claims regarding the economy:
Hot Air Balloon Number 4:
Here's what our Chappan-Inch-ka-Hero -- he who rescued 15000 Gujaratis in one Sunday afternoon as shown above -- delivers in front of a appreciative crowd:
And here is how he throws a challenge:
"Ho Jaaye Muqabla" (let's have a bout) on NDA's 6 years, versus UPA's 10 years.
Here is what BJP Deputy Leader in Rajya Sabha, and General Secretary, Mr Ravi Shankar Prasad says, releasing a chargesheet against the UPA:
Ok, so let's examine what the facts are regarding the allegation that UPA rule was a decade of destruction, and how Vajpayee's golden six-year reign compared with Manmohan Singh's much-maligned ten-year reign. I've already provided detailed analysis on NDA's creation of sixty million jobs versus UPA's destruction of jobs in my previous post -- Part 3 of this series.
Presented below is the UPA's report card compared to that of the NDA. I'm tabulating the facts first, and then providing detailed evidence on each item, so that readers can verify the sources and the correctness of the data. Please critically scrutinize every item presented, cross-check the authenticity and veracity of the data, and judge for yourself...! Every piece of data is backed up with online sources, of the most incontrovertible repute -- nothing is merely rehashed opinions of sundry commentators, which are often without any basis whatsoever. Please visit every link provided under every graphic listed below, and satisfy yourself.
A Note on the Sources:
The data presented below have been collected from the following authentic sources:
I have presented below the comparative performance of Manmohan Singh's ten years versus Vajpayee's six years on 125+ econometric parameters, grouped under a dozen headings. Many of these econometrics are standard ones, tracked by governments worldwide, and also by international financial bodies like the World Bank and the International Monetary Fund, to evaluate the performance of economies.
To keep the comparison apples-to-apples, I've tried to present the Compounded Annual Growth Rates (CAGR) for almost all the metrics. This will help readers judge the pace of growth and progress achieved under the respective regimes, without the results being unduly affected by their respective durations (10 years for UPA, versus 6 for NDA). Wherever I could, I digged out the metrics from the year 1997-98 (when Vajpayee took over as PM), year 2003-04 (when Vajpayee left and Manmohan took over as PM) and year 2013-14 (the last year of Manmohan).
Please check columns E and H for the performance achieved during the Vajpayee years and the Manmohan years respectively, in terms of CAGR.
Utmost care has been taken to ensure the correctness of the figures presented. Some inadvertent mistakes could remain in one or two places -- if you find any discrepancies, please let me know in the comments section, and I'll correct them.
The sources are invariably official and credible ones -- presented in full detail, with online links, at the end of the series of twelve performance charts. Readers are encouraged to visit the source links themselves, and verify the data.


(click image to enlarge)
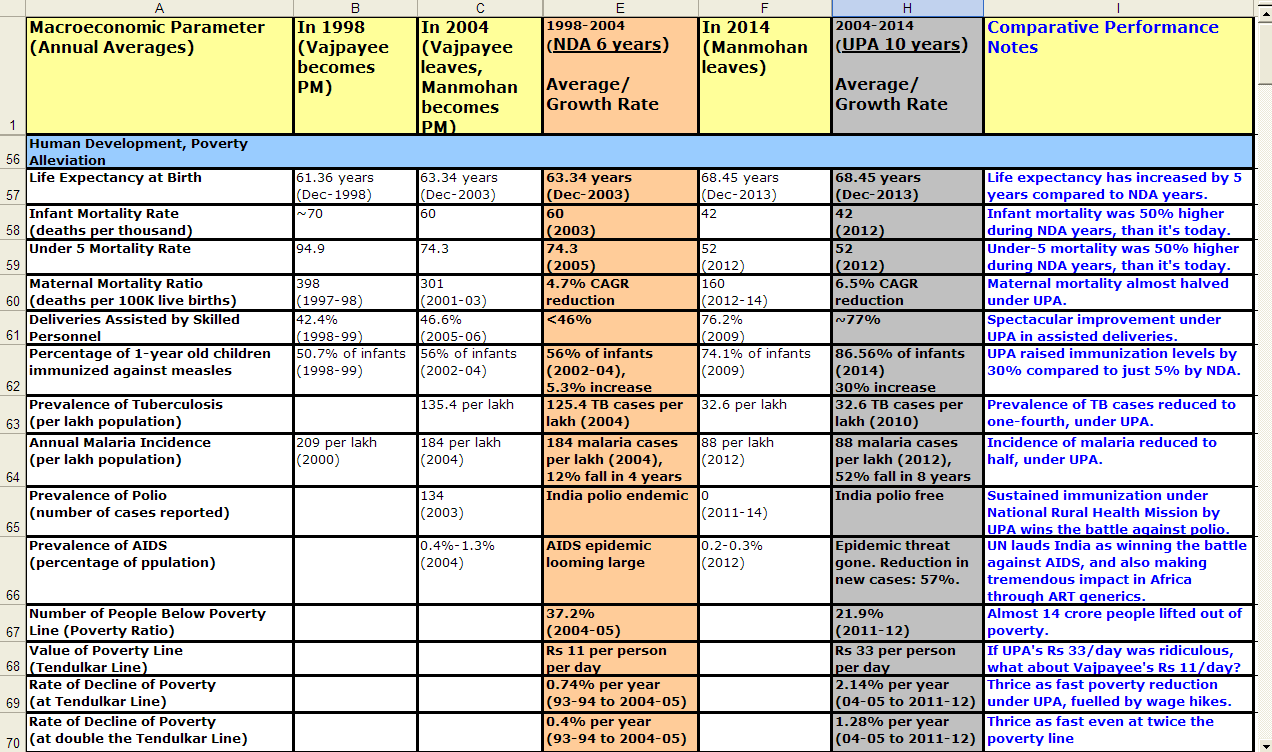 Chart 5 - Human Development, Health, Poverty Alleviation
How many times have you been told by the BJP and its partners-in-propaganda that the UPA has destroyed the economy in the last ten years...? Vajpayee ji's "vision", we're told, had created a "land of milk and honey", which the UPA squandered by indulging in its policies of "dole and giveaways". Now, there is apparently no other way but to submit to the superpowers of a Chappan-Inch Man (man of fifty-six inch chest!), to rescue the economy.
Much in the same way, one'd suppose, as he rescued 15000 people trapped in the Uttarakhand floods in just one Sunday afternoon (watch video below), with 80 Innova cars, and 4 Boeing Jets, putting to shame our armed forces which struggled for two fortnights to do the same thing in perilous terrain, with mounting losses of equipment (a rescue helicopter crashed) and personnel...! But those rescued were all Gujaratis (wonder how he figured out and picked only the Gujaratis among disaster victims...) -- so if you weren't one, tough luck. Choose you birth-state more judiciously, next time.
And read here and here how this miracle rescue act can be pulled off...! Several days later BJP President Rajnath Singh clarified that Modi ji himself never claimed to have rescued 15000 Gujaratis. But, a man who tweets by the hour, never got time to let the people know that it was all hoax, while it ran on television for days on end. Perhaps he had some problem with his cellular network provider, that prevented him from tweeting his hands off this. After all, a modest man like Modi ji never believes in making false claims himself. How the story was planted is reported here.
Anyway, let's us get back to economics now, and see what the BJP claims regarding the economy:
Hot Air Balloon Number 4:
UPA inherited a Ferrari economy in 2004, and reduced it to a Maruti 800, by 2014
Here's what our Chappan-Inch-ka-Hero -- he who rescued 15000 Gujaratis in one Sunday afternoon as shown above -- delivers in front of a appreciative crowd:
And here is how he throws a challenge:
"Ho Jaaye Muqabla" (let's have a bout) on NDA's 6 years, versus UPA's 10 years.
Here is what BJP Deputy Leader in Rajya Sabha, and General Secretary, Mr Ravi Shankar Prasad says, releasing a chargesheet against the UPA:
“The mismanagement of India’s economy under an economist Prime Minister, leading to price rise, higher unemployment and near-destruction of all engines of the economy is one of the biggest shames of the 10-year misrule of the Congress-led UPA,” BJP spokesperson Ravi Shankar Prasad said in a statement.
“With the critical state of economy because of gross mismanagement, with industrial production and manufacturing seriously crippled, it is no surprise that the UPA’s record at job creation has been extremely poor,” Mr. Prasad said.
Citing National Sample Survey Data, he said the NDA created 6.07 crore jobs in its six years. In comparison, in the eight years till 2012, for which data was available, the UPA could manage to create only 1.54 crore jobs.
Ok, so let's examine what the facts are regarding the allegation that UPA rule was a decade of destruction, and how Vajpayee's golden six-year reign compared with Manmohan Singh's much-maligned ten-year reign. I've already provided detailed analysis on NDA's creation of sixty million jobs versus UPA's destruction of jobs in my previous post -- Part 3 of this series.
Presented below is the UPA's report card compared to that of the NDA. I'm tabulating the facts first, and then providing detailed evidence on each item, so that readers can verify the sources and the correctness of the data. Please critically scrutinize every item presented, cross-check the authenticity and veracity of the data, and judge for yourself...! Every piece of data is backed up with online sources, of the most incontrovertible repute -- nothing is merely rehashed opinions of sundry commentators, which are often without any basis whatsoever. Please visit every link provided under every graphic listed below, and satisfy yourself.
A Note on the Sources:
The data presented below have been collected from the following authentic sources:
- Reserve Bank of India - Database on Indian Economy
- World Bank World Development Indicators 2014, using Knoema visualizations
- International Monetary Fund World Economic Outlook 2014, using Knoema visualizations
- Government of India - Open Data Platform
- Tradingeconomics
- Ministry of Statistics and Programme Implementation - Handbook of Statistics 2014, and Knoema visualizations
- Planning Commission Data Tables and Databook 2014
- Google Publicdata Explorer and Google Finance
- World Bank Commodity Prices Pink Datasheet 2014, using Knoema visualizations (original Excel sheet here)
- Transparency International Corruption Perception Score, using Knoema visualizations
- International Energy Statistics 2014, using Knoema visualizations
- Miscellaneous other official sources, noted under data
UPA's TEN YEAR REPORT CARD COMPARED TO THE NDA'S PREVIOUS SIX YEARS
I have presented below the comparative performance of Manmohan Singh's ten years versus Vajpayee's six years on 125+ econometric parameters, grouped under a dozen headings. Many of these econometrics are standard ones, tracked by governments worldwide, and also by international financial bodies like the World Bank and the International Monetary Fund, to evaluate the performance of economies.
To keep the comparison apples-to-apples, I've tried to present the Compounded Annual Growth Rates (CAGR) for almost all the metrics. This will help readers judge the pace of growth and progress achieved under the respective regimes, without the results being unduly affected by their respective durations (10 years for UPA, versus 6 for NDA). Wherever I could, I digged out the metrics from the year 1997-98 (when Vajpayee took over as PM), year 2003-04 (when Vajpayee left and Manmohan took over as PM) and year 2013-14 (the last year of Manmohan).
Please check columns E and H for the performance achieved during the Vajpayee years and the Manmohan years respectively, in terms of CAGR.
Utmost care has been taken to ensure the correctness of the figures presented. Some inadvertent mistakes could remain in one or two places -- if you find any discrepancies, please let me know in the comments section, and I'll correct them.
The sources are invariably official and credible ones -- presented in full detail, with online links, at the end of the series of twelve performance charts. Readers are encouraged to visit the source links themselves, and verify the data.
Chart 1 - Income Growth, Inflation, Savings
(click image to enlarge)
Chart 2 - GDP Growth, Government Debt and Deficits
(click image to enlarge)
 Chart 3 - Agriculture Development, Farm Credit, Productivity
(click image to enlarge)
 Chart 4 - Minimum Support Prices For Agricultural Produce
(click image to enlarge)
(click image to enlarge)
 Chart 6 - Inclusive Growth, Spread Of The Middle Class
(click image to enlarge)

Chart 7 - Investor Confidence displayed thru Foreign Direct Investments
(click image to enlarge)
 Chart 8 - Electricity -- Installed Capacity, Generation, Consumption
(click image to enlarge)
 Chart 9 - Infrastructure Development - Roads, Metro Rails
(click image to enlarge)
 Chart 10 - Infrastructure Development - Airports, Ports, Satellites
(click image to enlarge)
 Chart 11 - Growth of Industry and Manufacturing
(click image to enlarge)
 Chart 12 - Scientific Research, Corruption, Internal Security
(click image to enlarge)


 Chart 2- Img 12- Gross Government Fiscal Deficit (Center+States)
as Percentage of GDP
UPA Years vs NDA Years
(click image to enlarge)
 Chart 2- Img 13- Government Fiscal Deficit (Centre only)
as Percentage of GDP
UPA Years vs NDA Years
(click image to enlarge)
 Chart 2- Img 14- Government Current Account Deficit
as Percentage of GDP
UPA Years vs NDA Years
(click image to enlarge)
 Chart 2- Img 15- The Primary Driver Of Current Account Deficit Is Four-Fold Increase In Crude Oil Prices, And Tripling Of Gold And Silver Prices
The Bars Show The Volume Of Crude Oil Imports, While The Middle Blue Line Graph Shows The Crude Oil Bill -- Compare The Two
(click image to enlarge)
 Chart 2- Img 16- International Gold Prices Affecting CAD
UPA Years vs NDA Years
(click image to enlarge)
 Chart 2- Img 17- Current Account Deficit Drops To Five Year Low In The March-2014 Quarter After Gold Import Restrictions Are Set In By UPA
(click image to enlarge)
 Chart 2- Img 18- Contrary To The Prevailing Perception, UPA DID NOT Increase Fiscal Deficit Through Food Subsidies ("Doles"). Although Absolute Food Subsidies Grew From About 25000 Crore in 2003-04 to 72000 Crore In 2011-12, In Relative Terms It Was 1.0% Of GDP In 2003-04, While It Reduced To About 0.85% Of GDP In 2011-12
(click image to enlarge)
 Chart 2- Img 19- Under UPA (between 2003-04 and 2011-12)
Food Subsidy As A Percentage Of Agricultural (not overall) GDP Grew Marginally From 4.6% to 5%, While Fertlizer Subsidy More Than Doubled From 2.2% to 4.9%
(click image to enlarge)
 Chart 2- Img 20- Under NDA (between 1997-98 and 2003-04)
Food Subsidy Grew At 21.4% CAGR, While Fertlizer Subsidy At 3% CAGR
(click image to enlarge)
 Chart 2- Img 21- Under UPA (between 2003-04 and 2013-14)
Food Subsidy Grew At 13.85% CAGR, Fertlizer Subsidy At 19.05% CAGR
While Petroleum Subsidy Grew At 29.6% CAGR
UPA's Subsidy Burden For The Middle Classes (thru fuel subsidy) Grew Twice As Fast As That For Poorer Classes (thru food subsidy)
UPA Food Subsidy At 92K Crore is 0.81% Of GDP (113.22 Lakh Crore)
NDA Food Subsidy At 25.2K Crore was 0.89% Of GDP (28.38 Lakh Crore)
(click image to enlarge)
 Chart 2- Img 22- If UPA's "Policy Paralysis" Caused India's GDP Growth Rate To Fall From 9.6% In 2007 to 4.7% In 2014 (a 4.8% decline), How Come China's GDP Growth Rate Fell More From 14% To 7.7% (a 6.3% decline) In The Same Period Without Any UPA...? Why Did Brazil Come Down From 6% to 2% Growth In The Same Period?
(click image to enlarge)
 Chart 3- Img 1- Agricultural GDP Growth
UPA Years vs NDA Years
(click image to enlarge)
 Chart 3- Img 2- Decadal Agri Growth under UPA Highest in Indian History
(click image to enlarge)
 Chart 3- Img 3- Agri Growth vs Overall GDP 2000-2014
(click image to enlarge)
 Chart 3- Img 4- Agricultural Credit Growth under Vajpayee
18.3% CAGR
(click image to enlarge)
 Chart 3- Img 5- Agricultural Credit in 2013-14
(click image to enlarge)
 Chart 3- Img 6- Agricultural Credit Growth under Manmohan
23.8% CAGR
(click image to enlarge)
 Chart 3- Img 6- Growth in NPK Fertilizer Consumption
UPA Years vs NDA Years
(click image to enlarge)
 Chart 3- Img 7- Growth in Tractor Sales
UPA Years vs NDA Years
(click image to enlarge)
 Chart 3- Img 8- Record Bumper Crop and Tractor Sales in 2013-14
(click image to enlarge)
 Chart 3- Img 9- Foodgrain and Pulses Production
UPA Years versus NDA Years
(click image to enlarge)
 Chart 3- Img 10- Foodgrain and Pulses Production 2013-14
(click image to enlarge)
 Chart 3- Img 11- Common Commercial Crops Production
UPA Years versus NDA Years
(click image to enlarge)
 Chart 3- Img 12- Common Commercial Crops Production 2013-14
(click image to enlarge)
 Chart 3- Img 13- Fruits and Vegetables Production
UPA Years vs NDA Years
(click image to enlarge)
 Chart 3- Img 14- Fruits and Vegetables Production 2012-13
(click image to enlarge)
 Chart 3- Img 15- Milk Production Growth UPA Years vs NDA Years
(click image to enlarge)
 Chart 3- Img 16- Milk Production Growth UPA Years vs NDA Years
(click image to enlarge)
 Chart 3- Img 17- Eggs Production Growth UPA Years vs NDA Years
(click image to enlarge)
 Chart 3- Img 18- Eggs Production and Per Capita Consumption 2013
(click image to enlarge)
 Chart 3- Img 19- Foodgrain Yields Per Hectare
UPA Years vs NDA Years
(click image to enlarge)
 Chart 3- Img 20- Cotton and Other Commercial Crops Yields Per Hectare
UPA Years vs NDA Years
(click image to enlarge)
 Chart 4- Img 1- Minimum Support Prices Of Foodgrains
UPA Years vs NDA Years
(click image to enlarge)
 Chart 4- Img 2- Minimum Support Prices Of Commercial Crops
UPA Years vs NDA Years
(click image to enlarge)
 Chart 5- Img 1- Increase in Life Expectancy
UPA Years (68) vs NDA Years (63)
(click image to enlarge)
 Chart 5- Img 2- Life Expectancy Goes Up by 5 Years In A Decade
(click image to enlarge)
 Chart 5- Img 3- Infant Mortality Rate (Deaths Per Thousand)
UPA Years (42) vs NDA Years(60)
(click image to enlarge)
 Chart 5- Img 4- Under-5 Mortality Rate (Deaths Per Thousand)
UPA Last Year (52) vs NDA Last Year(74.3)
(click image to enlarge)
 Chart 5- Img 5- Maternal Mortality Ratio (Deaths Per lakh live births)
UPA Last Year (160) vs NDA Last Year(301)
(click image to enlarge)
 Chart 5- Img 6- Maternal Mortality Ratio (Deaths Per Lakh Live Births)
UPA Years vs NDA Years
(click image to enlarge)
 Chart 5- Img 7- Percentage Of Deliveries Assisted By Skilled Staff
UPA Last Year(77%) vs NDA Last Year(46%)
(click image to enlarge)
 Chart 5- Img 8- Percentage of 1-year-olds Immunized Against Measles
UPA Years (30% increase) vs NDA Years (5% increase)
(click image to enlarge)
 Chart 5- Img 9- Immunization Levels Fell Under NDA As Per World Bank
(click image to enlarge)
 Chart 5- Img 10- Prevalence Of Tuberculosis(Per Lakh Population)
UPA Years(32, in 2010) vs NDA Years(125, in 2004)
(click image to enlarge)
 Chart 5- Img 11- Incidence Of Malaria(Per Lakh Population)
UPA Years(88, in 2012) vs NDA Years(184, in 2004)
(click image to enlarge)
 Chart 5- Img 12- Malaria Incidence And Deaths Situation In India
UPA Years vs NDA Years
(click image to enlarge)
 Chart 5- Img 13- Prevalence Of Polio (Number of Cases Reported)
UPA Last Three Years(0) vs NDA Last Year(134)
(click image to enlarge)
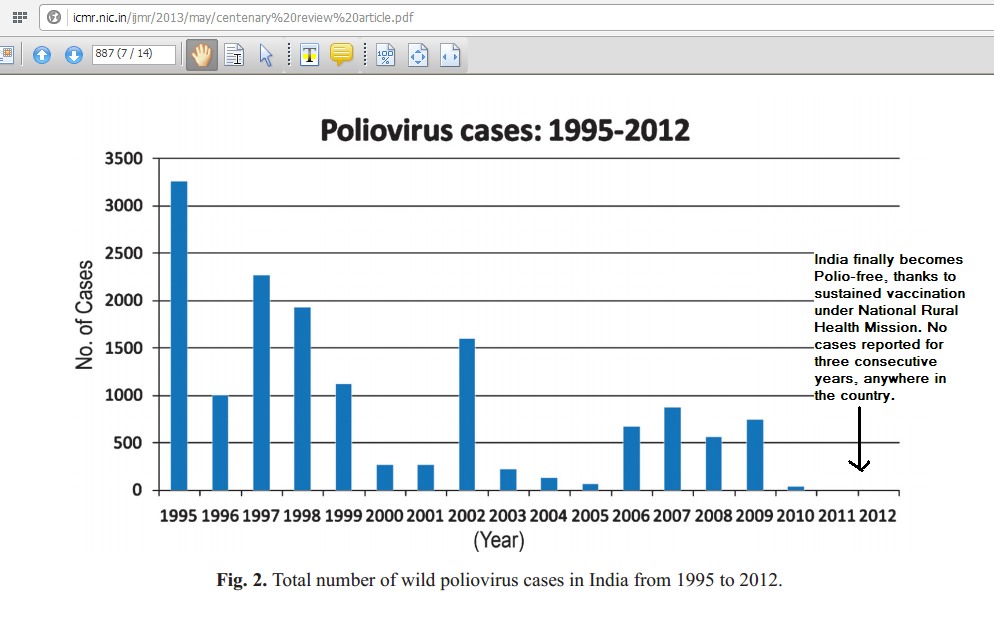 Chart 5- Img 14- Battle Against Polio Finally Won Under UPA
(click image to enlarge)
 Chart 5- Img 15- Prevalence Of HIV Among Adults (%age of Population)
UPA Years(0.27 in 2011) vs NDA Year(0.4% in 2004)
(click image to enlarge)

Chart 5- Img 16- Battle Against Aids
UPA Years vs NDA Years
(click image to enlarge)
 Chart 5- Img 17- HIV Prevalence Among Pregnant Women
UPA Years vs NDA Years
(click image to enlarge)
 Chart 5- Img 18- Looming Threat Of AIDS Epidemic in NDA Years
India With Highest Number Of HIV+ Outside South-Africa
(click image to enlarge)
 Chart 5- Img 19- India Reduced New HIV Infections By 57% Since 2001
While In Pakistan It Grew Eight-Fold In The Same Period
(click image to enlarge)
 Chart 5- Img 20- UN Lauds India As Winning The Battle Against AIDS Under UPA
(click image to enlarge)
 Chart 5- Img 21- What Caused India's AIDS Epidemic To Change Course
(click image to enlarge)
 Chart 5- Img 22- UPA Lifted 14 Crore People Out Of Poverty
Three Times Faster Reduction in Poverty Under UPA
Both At Tendulkar Line, and Double The Tendulkar Line
(click image to enlarge)
 Chart 5- Img 23- Poverty Reduction Rural Areas
UPA Years vs NDA Years
(click image to enlarge)
 Chart 5- Img 24- Poverty Reduction Urban Areas
UPA Years vs NDA Years
(click image to enlarge)
 Chart 5- Img 25- For Those Who Call UPA's 2011 Poverty Line Of Rs 33 Per Day Ridiculous, How About Vajpayee's Rs 15 Per Day in 2004?
(click image to enlarge)
 Chart 5- Img 26- The Tendulkar Poverty Line Is The Purchasing Power Parity Equivalent Of $1.25/day, Used Internationally
(click image to enlarge)
 Chart 5- Img 27- Rs 33 Per Day Means Spending Of
Rs 5000 Per Month For A Family Of Five
(click image to enlarge)
 Chart 6- Img 1- Per Capita Energy Consumption And Its Growth Rate
UPA Years(6.7 MWH, 2013) vs NDA Years (3.3 MWH, 2004)
(click image to enlarge)
 Chart 6- Img 2- Number Of Mobile Phone & Internet Subscribers and Overall Teledensity in Mar-2004
(click image to enlarge)
 Chart 6-Img3 - Number Of Mobile Phone & Internet Subscribers and Overall Teledensity in Mar-2014
(click image to enlarge)
 Chart 6- Img 4- Growth In Number Of Internet Subscribers Under UPA
(click image to enlarge)
 Chart 6- Img 5- 24 crore Intenet Subscribers in Dec-2013
Compared to 45 lakhs in Mar-2004
(click image to enlarge)
 Chart 6- Img 6- NDA Took Teledensity from 1.9 in 1998 to 7.04 in 2004
(click image to enlarge)
 Chart 6- Img 7- UPA Took Teledensity from 7.04 in 2004 to 73.5 in 2013
(click image to enlarge)
 Chart 6- Img 8- 22 crore Wireless Internet Users and
6.3 crore DTH TV Users in Dec 2013
(click image to enlarge)
 Chart 6- Img 9- 18.5 Crore Smartphone Users By Jun-2014
(click image to enlarge)
 Chart 6- Img 10- NDA Took Cable TV Households
From 2 crore in 1997 to 4.3 crore in 2003
(click image to enlarge)
 Chart 6- Img 11- UPA Took Cable TV Households
From 4.3 crore in 2003 to 13.9 crore in 2013
(click image to enlarge)
 Chart 6- Img 12- From 93 TV Channels Under NDA To 850+ Under UPA
(click image to enlarge)
 Chart 6- Img 13- From Zero DTH Subscribers in 2004
to 6.3 crore in Dec 2013
(click image to enlarge)
 Chart 6- Img 14- Vajpayee Govt Likened DTH TV to Porn
and Disallowed It For Years
(click image to enlarge)
 Chart 6- Img 15- UPA More Than Doubled Vehicle Owners In India
Cars: from 72 Lakhs in 2004 to 1.75 crore in 2012
Bikes: from 5.2 crores in 2004 to 11.5 crore in 2012
(click image to enlarge)
 Chart 6- Img 16- Vajpayee Added 3K New Bank Branches,
Manmohan added 38.5K
(click image to enlarge)
 Chart 6- Img 17- India Had 12 Thousand ATMs in Mar-2004
(click image to enlarge)
 Chart 6- Img 18- India Had 160 Thousand ATMs in Mar-2014
(click image to enlarge)
 Chart 6- Img 19- India Had 2.7 Crore Debit Card Holders on 31-Dec-2003
(click image to enlarge)
 Chart 6- Img 20- India Had 39.4 Crore Debit Card Holders in Mar-2014
(click image to enlarge)
 Chart 6- Img 21- Growth of ATMs in India
UPA Years vs NDA Years
(click image to enlarge)
 Chart 6- Img 22- ATM Story Receives Push From The Finance Ministry
(click image to enlarge)
 Chart 6- Img 23- Kisan Credit Card Holders
NDA created 1.76 crore, UPA Created 10+ crore
(click image to enlarge)
 Chart 6- Img 24- Vajpayee Grew Bank Fixed Deposits @ 17% CAGR
From 5 Lakh Crore to 13 Lakh Crore
(click image to enlarge)
 Chart 6- Img 25- Manmohan Grew Bank Fixed Deposits @ 18.7% CAGR
From 13 Lakh Crore to 61 Lakh Crore
(click image to enlarge)
 Chart 6- Img 26- Mutual Fund Assets Grew
Under Vajpayee @ 6.2% CAGR, From ~1 Lakh Crore to 1.4 Lakh Crore
Under Manmohan @ 20.5% CAGR, From 1.4 Lakh Crore to 9 Lakh Crore
(click image to enlarge)
 Chart 6- Img 27- Mutual Fund Assets Stand At 9 Lakh Crore in Mar-2014
(click image to enlarge)
 Chart 7- Img 1- Investments As A Percentage Of GDP
UPA Years (35% of GDP) vs NDA Years (25% of GDP)
(click image to enlarge)
 Chart 7- Img 2- Foreign Direct Investments in India
NDA Years - 4 billion dollars per year, totalling 24 billion
UPA Years - 32 billion dollars per year, totalling 319 billion
(click image to enlarge)
 Chart 7- Img 3- Foreign Direct Investments Brought in India
NDA - 19.52 billion dollars
UPA-I - 114.55 biliion dollars
UPA-II -172.82 biliion dollars
(click image to enlarge)
 Chart 7- Img 4- Apart From 319 Billion Dollars Of FDI
UPA Also Attracted 144 billion dollars Of FII, versus NDA's 14 billion
(click image to enlarge)
 Chart 7- Img 5- FDI In India Post-Liberalization
Really Took Off From Year 2006
(click image to enlarge)
 Chart 7- Img 6- In 2013, India Ranked Fifth Worldwide
In The A. T. Kearney FDI Confidence Index
(click image to enlarge)
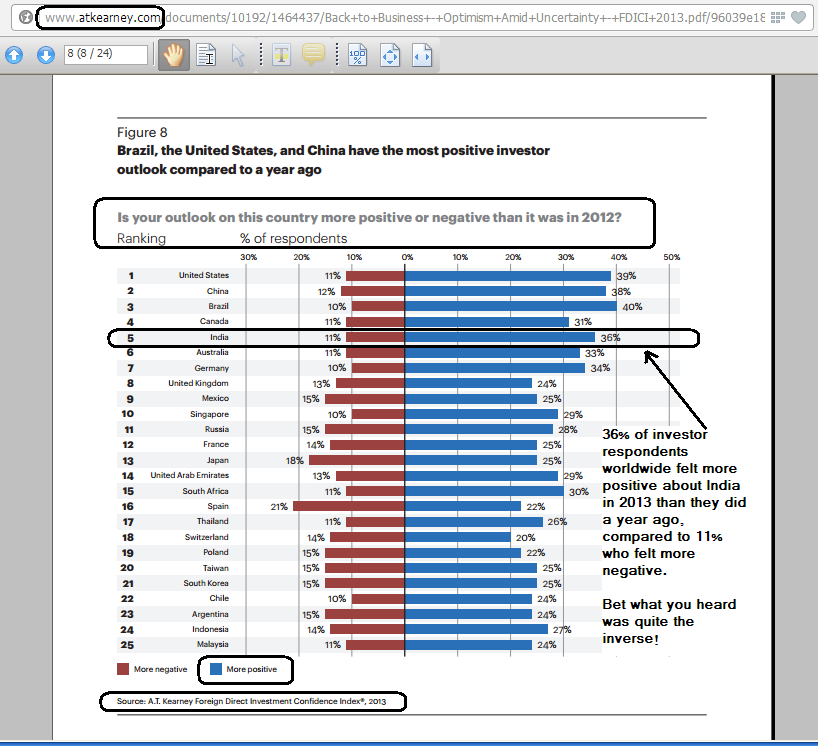 Chart 7- Img 7- Thrice As Many Foreign Investors (36% vs 11%) Felt More Positive About India in 2013 than a Year Ago
(click image to enlarge)
 Chart 7- Img 8- Gujarat Model Of Foreign Direct Investment
And Jobs Creation
(click image to enlarge)
 Chart 7- Img 9- Foreign Exchange Reserves 1990-2014
(click image to enlarge)
 Chart 7- Img 10- Investor Confidence Demonstrated Through Venture Capital Flow And Private Equity Deals In India
Manmohan Years vs Vajpayee Years
(click image to enlarge)
 Chart 7- Img 11- As Per The 'India Private Equity Report 2014' Published By Bain And Company, Venture Capital And Private Equity Deals Showed An Uptick of 16% In 2013, Even Amidst The Prevailing Commentary Of Doom
(click image to enlarge)


(click image to enlarge)


(click image to enlarge)


Conclusions:
- UPA grew per-capita income at 13.2% CAGR for ten years, when consumer price inflation grew at a very high 8.75% CAGR. NDA for six years, had consumer price inflation grow at a much lower 3.9% CAGR, and grew per-capita income at 8.5% CAGR. Adjusted for inflation, under NDA rural wage growth (at 3.6% CAGR) was negative, while under UPA, rural wage growth (at 12.3% CAGR) was 3.5% positive. Retail petrol prices just doubled from Rs 33.7 in Mar-2004 to Rs 73.1 in Mar-2014, despite international crude oil prices having quadrupled from average $23 per barrel under Vajpayee to over $90 per barrel under UPA-II. UPA has destroyed people's incomes and personal finances!
- Under UPA stock markets gave 16.5% CAGR returns for ten years, while under NDA they returned just 4.6% CAGR over six years. UPA has destroyed stock market returns because of policy paralysis, and NDA is the darling of the markets!
- Inflation excluded (i.e. at constant prices), NDA grew the economy from 21.33 lakh crore to 30 lakh crore in six years. UPA doubled it to almost 62 lakh crores in ten years. India stands third in the world in terms of GDP by purchasing power parity today. UPA has destroyed the economy!
- UPA brought down not only India's GDP growth from 9.5% in 2007 to 4.7% in 2014, but also China's GDP growth rate from 14% in 2007 to 7.7% in 2014 and Brazil's GDP growth rate from 6% in 2007 to 2% in 2014. Forget the fact that under UPA, India grew 3.7% faster than the world, compared to 2.6% faster that it did under NDA. UPA's policy paralysis is so powerful that it can bring down the entire world economy and also cause the largest economic meltdown that the world has seen in a century!
- NDA inherited a gross national debt of 66% and grew it to 83% by the time it left six years later. UPA brought down gross national debt from 83% back to 66%. UPA has bankrupted the government coffers!
- Gross fiscal deficit (center+states) averaged at 9% of GDP per annum during NDA years. During UPA years it averaged 7% per annum. UPA's profligacy has crumbled the government's balance sheet!
- Gross domestic savings and investment averaged around 25% of GDP under NDA. Under UPA, the average rose to 33% of GDP. Fixed deposits in banks grew from 13 lakh crores in Mar-2004 to 61 lakh crores in Mar-2014. Mutual Fund assets grew from 1.4 lakh crores in Mar-2004 to over 9.1 lakh crore in Mar-2014. UPA has destroyed people's savings capacity!
- Agriculture grew 58% faster during UPA years (3.51% CAGR) than during NDA years (2.22% CAGR), achieving highest decadal growth in India's history. UPA has destroyed agriculture!
- Tractor sales reduced from 2.48 lakhs in 1997-98 to 1.9 lakhs in 2003-04, during NDA years, reflecting poor farm income growth. UPA more than tripled tractor sales to 6.34 lakhs in 2013-14. UPA has destroyed farmer's livelihoods!
- Under NDA agricultural minimum support prices grew from Rs 729 (composite price of 9 major foodgrain and commercial crops) in 1997-98 to Rs 1011 in 2003-04 -- a growth of mere 39% in six years. Under UPA, the composite MSP grew to Rs 2598 -- a whopping 257% growth in ten years. UPA has left farmers in penury!
- During NDA years, infant and under-five child mortality was 50% higher than now, annual malaria incidence was double, tuberculosis incidence was four times higher, India was a polio-endemic nation, and India had the highest HIV+ population after South Africa in the world. Today India is polio-free (no cases reported for three consecutive years), AIDS has ceased to be an epidemic threat, child immunization rates have grown from 56% in (2002-04) to 87% in 2014, professionally assisted deliveries have grown from 46% to 77%, and overall life expectancy has increased by 5 years. All the UPA has given is scams which have ruined the nation's health and well-being!
- Poverty reduction was three times faster under UPA than under NDA. UPA lifted almost 14 crore people out of poverty. Oh, that was just because it kept a ridiculous poverty line of Rs 33 per day! Never mind that Rs 33 per day is the purchasing power parity equivalent $1.25 per day which is the worldwide poverty line used by the UN and most countries, including China. And never mind that the rural poverty line under Vajpayee used to be just Rs 11.88 per day! Poverty reduction was thrice as fast even at double the Tendulkar Line (Rs 66/day).
- UPA created over 5.5 crore real jobs (those that have a Provident Fund Number with them) at the rate of over 54 lakh jobs per year for ten years. NDA had created 1.87 lakh real jobs, at the rate of 31.5 lakh jobs per year for six years. Job creation under UPA was 72% faster than under NDA. UPA has destroyed the chances of jobs for youth!
- When Vajpayee left, India had about 73 lakh car owners. By 2013, there were over 2 crores. UPA created almost two-thirds of the country's car owners. Motorcycle owners more than doubled from 5.2 crores to 12.9 crores. Passengers availing international flights increased from 1.66 crore in 2003-04 to 4.25 crore in 2013-14, while those availing domestic flights increased 3.5 times from 3.2 crore to 11.2 crore. Smartphone/feature-phone owners increased from zero in 2004 to 22 crores in 2013. UPA has pauperized the middle classes through inflation!
- When Vajpayee left, India had about 12000 ATMs; today we have over 160,000. Vajpayee added less than 3000 new bank branches; Manmohan added over 38500 new bank branches. In 2004, India had 2.7 crore debit card holders; today it has over 39 crores. In 2003-04, per-capita-energy-consumption was 3.3 MWH, in 2012-13 it doubled to 6.7 MWH. Vajpayee delivered India's "golden years" of inclusive growth, UPA produced its ruins!
- In 2004, we had 4.3 crore cable TV subscriber households; today we have 14 crore households having cable TV. In 2004, India had virtually zero Direct-to-Home (DTH) television subscribers; today over 6.3 households have DTH. In 2004, there were 93 cable channels; today we have over 850. UPA has shackled media and muffled political freedom!
- In Mar-2004, India had 3.37 crore mobile phone connections; in March-2014 India had 90.34 crore. Almost 96% of India's mobile subscribers came into being under UPA. In Mar-2004, India had just 45.5 lakh internet subscribers, of which just 1.9 lakhs were on broadband (>256 kbps). Today, the number of internet subscribers has grown to over 24 crores (a 50-fold jump) and broadband (>512 kbps) subscribers has grown to 5.8 crores (a 300-fold jump). Teledensity increased from 7% in 2004 to 75% in 2014. The rest of the world calls it a telecom revolution under UPA; in India we call it 2G-SCAM!
- Vajpayee brought a total of 24 billion dollars of FDI in six years, averaging $4 billion a year. Manmohan brought in over 319 billion dollars of FDI in ten years, averaging 32 billion dollar per year, which is eight-times higher than what Vajpayee achieved. In 2013, India ranked fifth in the world in the A.T. Kearney FDI Confidence Index, despite the incessant noise about policy paralysis. Manmohan Singh has decimated investor confidence in India!
- Vajpayee increased India installed power generation capacity from 102 GW to 131 GW, at 4.85 GW/year. Manmohan increased installed power capacity from 131 GW to 285 GW, at 15.34 GW/year, which is thrice as fast. Over 54% of India's entire power generation capacity was installed under Manmohan. UPA has plunged the country into an abyss of electrical darkness!
- Vajpayee had increased renewable power generation from 1 GW to 2.5 GW in six years. Manmohan increased it to 32 GW in ten years. Vajpayee was a great visionary who championed renewable energy!
- Per-capita electricity consumption increased from 390 KWH in 2003-04 to 917 KWH in 2012-13. Domestic electricity consumption per capita increased from 84 KWH to 202 KWH. Over 96% of India's villages are electrified today compared to 83% when Vajpayee left. Manmohan has starved the people of this country of electricity!
- Vajpayee invested 4.5% of the GDP into infrastructure development in 2003-04. Manmohan invested almost 9% of the the GDP into infrastructure development in 2013-14. Food subsidy -- although risen in absolute terms from 25K crore in 2003-04 to expected 125K crore in 2013-14 -- was 1% of GDP under Vajpayee, and remained at 1% of GDP under Manmohan. Petroleum subsidy, primarily consumed by the middle classes, grew at 29.6% CAGR over ten years, compared to food subsidy growth of 13.9% CAGR. All UPA spent money on was "doles" for the poor for votes...!
- Vajpayee actually built only 1846 km (31%) of the Golden Quadrilateral's entire length of 5846 km, as per the CAG report of 2005. The remaining 4000 km of GQ were built under UPA. Coming to the North-Soth-East-West (NSEW) corridor, Vajpayee built just built 588 km (8%), while 5694 km were built under UPA. Thus, 70% of GQ and 80% of NSEW were built under UPA. Vajpayee had added just 3409 km of four-laned highways; Manmohan added 18956 km of four/six-laned highways. UPA laid down the master plan of building over 18K km of greenfield six-laned expressways to be built in three phases by 2022 at a cost of over 3 lakh crores, with the first phase already underway. Vajpayee was the chief architect of India's national highways!
- Vajpayee built just 30K km of new paved rural roads in 3.5 years since the launch of Pradhan Mantri Gram Sadak Yojana, and upgraded another 20K km. Manmohan built 213K km of new all-weather rural roads in ten years, and upgraded another 122K km. At seven times of what Vajpayee achieved, it's an unprecedented revolution in rural road infrastructure under Manmohan. Who cares about rural roads revolution anyway, it's all just a waste for "votebank politics"...!
- Vajpayee operationalized just one Metro Rail in six years (two lines of Delhi Metro). Manmohan operationalized Metro Rails in Bangalore, Mumbai, Gurgaon apart from four new lines of Delhi Metro. Six other Metro Rail projects are under rapid construction, and another sixteen are under planning. UPA sanctioned Metro Rail for every city with 2+ million population, at a cost of over 2 lakh crores. Mumbai-Vadodara high-speed-rail (bullet train, at 350 km/hr) project already completed detailed feasibility study and under implementation. Dedicated Railway Freight Corridors (East and West) under implementation. 24 railway infrastructure projects worth 7300 crore went live in 2013-14. UPA failed on all counts in infrastructure building!
- UPA built nine new international aiports in Delhi, Mumbai, Hyderabad, Bangalore, Kolkata, Chennai, Nagpur, Kochi and Ahmedabad. Delhi and Hyderabad have been rated as among the top 5 in their respective categories worldwide, finished in record three years' time. Mumbai and Bangalore airports too figure among the world's top 100. 35 non-metro airports have been modernized. Passenger capacity has trebled or quadrupled post modernization. Airports building budget has been increased almost ten times from 6900 crore in 10th Plan to 67500 crore in the 12th Plan, with 75% funds coming from the private sector. Vajpayee modernized just one international airport (Chennai), and had prohibited airport building in non-metros citing "lack of flights landing". Vajpayee's vision was responsible for India's world-class airports! (Yeah, he envisioned upgrading Delhi, Mumbai, Hyderabad airports since 1999 -- never got a brick laid in his six years of rule.)
- India put 35 satellites into orbit under Manmohan compared to just 11 under Vajpayee, landed one on the Moon successfully, sent another to Mars which's reaching there in 3 months' time, acquired Intercontinental Ballistic Missiles (5000+ km range) and Cryogenic Engine capability, on way to operationalizing indigenous satellite navigation like GPS by 2015, satnav based GAGAN aircraft navigation system operationalized. Telecom satellites, GPS navigation, aircraft trackers, cryogenic engines, interplanetary travel? -- this is all UPA's science fiction, who calls them infrastructure...?
- Between 2003-04 and now, annual automobile production has tripled from 7.2 million vehicles to 20.6 million vehicles, annual electronics hardware production has quadrupled from 0.44 lakh crore to 1.78 lakh crore, annual steel production has doubled from 37 million tons to 78+ million tons (with India becoming the fourth largest producer of steel in the world), annual cement production has doubled from 123 million tons to 251 million tons, annual software production has increased 8.5 times from 75K crore to 640K crore, annual pharma exports have grown six-fold from 15K crore to 90K crore, biotech industry has grown from 3475 crore to 23524 crore, food processing industry has grown from 1.6 lakh crore to 9.5 lakh crore a year, media and entertainment industry has grown from 19600 crore to 91800 crore a year, foreign tourist arrivals have increased from 27 lakhs to 68 lakhs a year, foreign exchange earnings through tourism has quadrupled from $4.5 billion to $18 billion a year. As per the Global Manufacturing Competitiveness Index published by Deloitte, India stood fourth in the world in 2013. UPA has been a decade of destruction for industry and manufacturing!
- Under Vajpayee, India saw a 1% improvement in Transparency International Corruption Perception Index score, and slipped 19 slots in world ranking in three years. Under Manmohan, India saw an 8% improvement in Transparency International Corruption Perception Index score, and slipped 4 slots in world ranking in ten years. In the same period, China slipped 9 slots, Brazil slipped 13 slots, South Africa slipped 28 slots, and Russia slipped a staggering 37 slots. UPA has been a decade of scams and corruption, unmatched in history and in the world!
- In 2003 (last full year of Vajpayee), terrorists incidents in Jammu and Kashmir claimed 795 civilian lives and 314 security personnel lives. In 2013 (last full year of Manmohan), terrorists incidents in Jammu and Kashmir claimed 15 civilian lives and 15 security personnel lives. During Vajpayee's six years, terrorism all-India claimed on average 1509 civilian lives, and 640 security personnel lives every year (this excludes Maoist deaths, which are extra). During Manmohan's last five years, terrorism all-India claimed on average 515 civilian lives, and 266 security personnel lives every year (this includes Maoist deaths). UPA's weak leadership has destroyed India's internal security and people are fearful of going out of their homes (forget going to Kashmir) thanks to rampant terrorism!
Detailed Chartwise Evidence
Evidence for Chart 1: Inflation, Income Growth, Savings
Chart 1- Img 1 - Low Consumer Inflation During NDA Years
(click image to enlarge)
Chart 1- Img 2 - Very High Food Inflation During UPA Years
(click image to enlarge)
 Chart 1- Img 3 - Inflation Was Low In All Developing Economies between 1998-2004 (NDA years), Not Just India
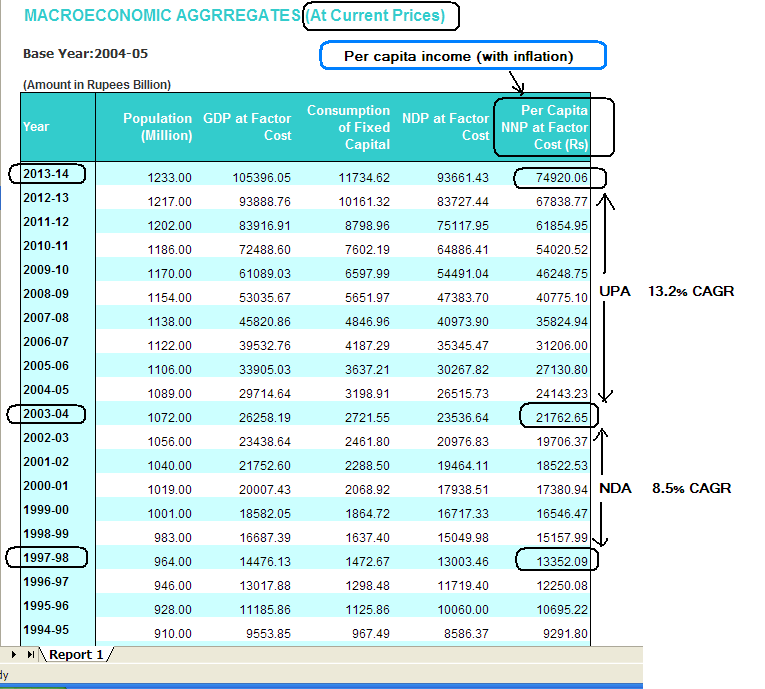 Chart 1- Img 4- Per Capita Income Growth During UPA versus NDA Years
(click image to enlarge)
(current prices, i.e. including inflation)
(click image to enlarge)
 Chart 1- Img 5- Per Capita Income Growth During UPA versus NDA Years
(click image to enlarge)
 Chart 1- Img 7- Average Nominal Daily Wage Rate Growth
(click image to enlarge)
 Chart 1- Img 8- Average Nominal Daily Wage Rate Growth
(click image to enlarge)
 Chart 1- Img 9- India Savings As a Percentage of GDP
(click image to enlarge)
 Chart 1- Img 10- India Savings As a Percentage of GDP
(click image to enlarge)
 Chart 1- Img 11- India Savings vs World Savings as Percentage of GDP
(click image to enlarge)
 Chart 1- Img 12- Sensex Returns, Manmohan Years vs Vajpayee Years
(click image to enlarge)
 Chart 1- Img 13- Sensex When Vajpayee Becomes PM
(click image to enlarge)
 Chart 1- Img 14- Sensex When Vajpayee Leaves As PM
(click image to enlarge)
 Chart 1- Img 15- Sensex When Manmohan About To Leave As PM
(click image to enlarge)
 Chart 1- Img 16- International Crude Oil Prices During NDA Years
Were a Quarter of What They Were During UPA Years
(click image to enlarge)
 Chart 1- Img 17- Petrol Price in Delhi When Vajpayee Became PM
(in Jun-1998: Rs 23.94)
(click image to enlarge)
 Chart 1- Img 18- Petrol Price in Delhi When Vajpayee Leaves As PM
(in Mar-2004: Rs 33.71)
(click image to enlarge)
 Chart 1- Img 19- Petrol Price in Delhi When Manmohan Leaves As PM
(in Mar-2014: Rs 73.61)
(click image to enlarge)
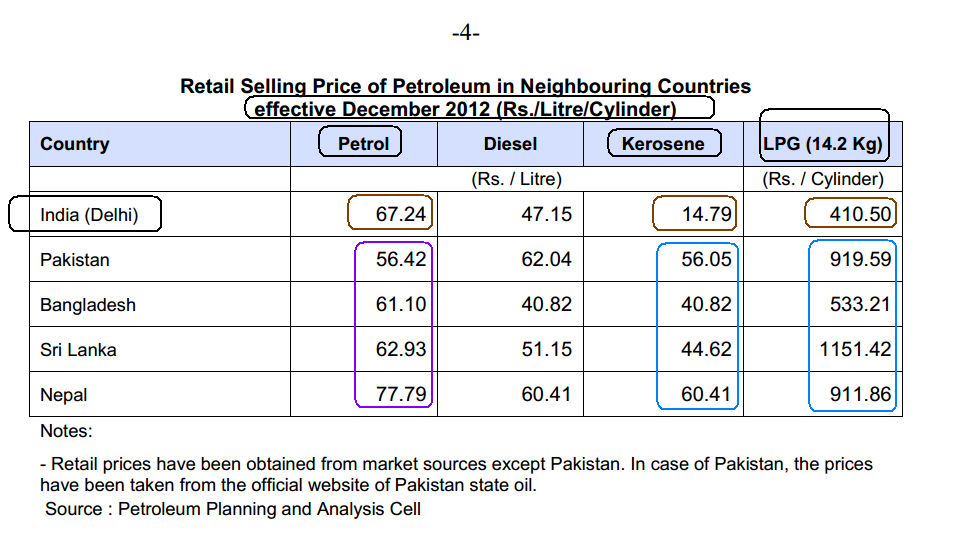
Chart 1- Img 20- Petrol, Diesel, Kerosene, LPG Prices
in India's Neighborhood
(click image to enlarge)
 Chart 1- Img 21- Consumption of Petroleum Products
(Year 2000-01 to 2011-2)
(click image to enlarge)
 Chart 1- Img 22- Consumption of Petroleum Products
(Year 2012-13)
(click image to enlarge)
 Chart 2- Img 1- Real GDP UPA Years Versus NDA Years
(click image to enlarge)
 Chart 2- Img 2- Real GDP Growth Rate UPA Years Versus NDA Years
(click image to enlarge)
 Chart 2- Img 3- Nominal GDP UPA Years Versus NDA Years
(click image to enlarge)
 Chart 2- Img 4- Nominal GDP Growth Rate UPA Years Versus NDA Years
(click image to enlarge)
 Chart 2- Img 5- Real GDP Growth - India vs The World
during UPA Years vs NDA Years
(click image to enlarge)
 Chart 2- Img 6- India GDP by Purchasing Power Parity (PPP)
UPA Years Versus NDA Years
(click image to enlarge)
 Chart 2- Img 7- India Worldwide Rank of GDP by PPP
Ranked 7 When Vajpayee Became PM (1997-98)
(click image to enlarge)
 Chart 2- Img 8- India Worldwide Rank of GDP by PPP
Ranked 5 When Vajpayee Ceases to be PM (2003-04)
(click image to enlarge)
 Chart 2- Img 9- India Worldwide Rank of GDP by PPP
Ranked 3 When Manmohan Ceases to be PM (2013-14)
(click image to enlarge)
 Chart 2- Img 10- Gross Government Debt as Percentage of GDP
UPA Years vs NDA Years
(click image to enlarge)
 Chart 2- Img 11- Gross Government Debt (Centre only, and Center+States) as Percentage of GDP
UPA Years vs NDA Years
(click image to enlarge)
(constant prices, i.e. excluding inflation)
(click image to enlarge)
 Chart 1- Img 6- Average Real Daily Wage Rate Growth
(click image to enlarge)
(click image to enlarge)
(click image to enlarge)
(click image to enlarge)
(click image to enlarge)
(click image to enlarge)
(click image to enlarge)
(click image to enlarge)
(click image to enlarge)
(click image to enlarge)
Were a Quarter of What They Were During UPA Years
(click image to enlarge)
(in Jun-1998: Rs 23.94)
(click image to enlarge)
(in Mar-2004: Rs 33.71)
(click image to enlarge)
(in Mar-2014: Rs 73.61)
(click image to enlarge)
Chart 1- Img 20- Petrol, Diesel, Kerosene, LPG Prices
in India's Neighborhood
(click image to enlarge)
(Year 2000-01 to 2011-2)
(click image to enlarge)
(Year 2012-13)
(click image to enlarge)
Evidence for Chart 2:
GDP Growth, Govt Debt, Govt Deficits, Subsidies
(click image to enlarge)
(click image to enlarge)
(click image to enlarge)
(click image to enlarge)
during UPA Years vs NDA Years
(click image to enlarge)
UPA Years Versus NDA Years
(click image to enlarge)
Ranked 7 When Vajpayee Became PM (1997-98)
(click image to enlarge)
Ranked 5 When Vajpayee Ceases to be PM (2003-04)
(click image to enlarge)
Ranked 3 When Manmohan Ceases to be PM (2013-14)
(click image to enlarge)
UPA Years vs NDA Years
(click image to enlarge)
UPA Years vs NDA Years
(click image to enlarge)
as Percentage of GDP
UPA Years vs NDA Years
(click image to enlarge)
as Percentage of GDP
UPA Years vs NDA Years
(click image to enlarge)
as Percentage of GDP
UPA Years vs NDA Years
(click image to enlarge)
The Bars Show The Volume Of Crude Oil Imports, While The Middle Blue Line Graph Shows The Crude Oil Bill -- Compare The Two
(click image to enlarge)
UPA Years vs NDA Years
(click image to enlarge)
(click image to enlarge)
(click image to enlarge)
Food Subsidy As A Percentage Of Agricultural (not overall) GDP Grew Marginally From 4.6% to 5%, While Fertlizer Subsidy More Than Doubled From 2.2% to 4.9%
(click image to enlarge)
Food Subsidy Grew At 21.4% CAGR, While Fertlizer Subsidy At 3% CAGR
(click image to enlarge)
Food Subsidy Grew At 13.85% CAGR, Fertlizer Subsidy At 19.05% CAGR
While Petroleum Subsidy Grew At 29.6% CAGR
UPA's Subsidy Burden For The Middle Classes (thru fuel subsidy) Grew Twice As Fast As That For Poorer Classes (thru food subsidy)
UPA Food Subsidy At 92K Crore is 0.81% Of GDP (113.22 Lakh Crore)
NDA Food Subsidy At 25.2K Crore was 0.89% Of GDP (28.38 Lakh Crore)
(click image to enlarge)
(click image to enlarge)
Evidence for Chart 3:
Agricultural Growth and Productivity
UPA Years vs NDA Years
(click image to enlarge)
(click image to enlarge)
(click image to enlarge)
18.3% CAGR
(click image to enlarge)
(click image to enlarge)
23.8% CAGR
(click image to enlarge)
UPA Years vs NDA Years
(click image to enlarge)
UPA Years vs NDA Years
(click image to enlarge)
(click image to enlarge)
UPA Years versus NDA Years
(click image to enlarge)
(click image to enlarge)
UPA Years versus NDA Years
(click image to enlarge)
(click image to enlarge)
UPA Years vs NDA Years
(click image to enlarge)
(click image to enlarge)
(click image to enlarge)
(click image to enlarge)
(click image to enlarge)
(click image to enlarge)
UPA Years vs NDA Years
(click image to enlarge)
UPA Years vs NDA Years
(click image to enlarge)
Evidence for Chart 4: Agricultural Minimum Support Prices
UPA Years vs NDA Years
(click image to enlarge)
UPA Years vs NDA Years
(click image to enlarge)
Evidence for Chart 5:
Human Development, Health, Poverty Alleviation
UPA Years (68) vs NDA Years (63)
(click image to enlarge)
(click image to enlarge)
UPA Years (42) vs NDA Years(60)
(click image to enlarge)
UPA Last Year (52) vs NDA Last Year(74.3)
(click image to enlarge)
UPA Last Year (160) vs NDA Last Year(301)
(click image to enlarge)
UPA Years vs NDA Years
(click image to enlarge)
UPA Last Year(77%) vs NDA Last Year(46%)
(click image to enlarge)
UPA Years (30% increase) vs NDA Years (5% increase)
(click image to enlarge)
(click image to enlarge)
UPA Years(32, in 2010) vs NDA Years(125, in 2004)
(click image to enlarge)
UPA Years(88, in 2012) vs NDA Years(184, in 2004)
(click image to enlarge)
UPA Years vs NDA Years
(click image to enlarge)
UPA Last Three Years(0) vs NDA Last Year(134)
(click image to enlarge)
(click image to enlarge)
UPA Years(0.27 in 2011) vs NDA Year(0.4% in 2004)
(click image to enlarge)
Chart 5- Img 16- Battle Against Aids
UPA Years vs NDA Years
(click image to enlarge)
UPA Years vs NDA Years
(click image to enlarge)
India With Highest Number Of HIV+ Outside South-Africa
(click image to enlarge)
While In Pakistan It Grew Eight-Fold In The Same Period
(click image to enlarge)
(click image to enlarge)
(click image to enlarge)
Three Times Faster Reduction in Poverty Under UPA
Both At Tendulkar Line, and Double The Tendulkar Line
(click image to enlarge)
UPA Years vs NDA Years
(click image to enlarge)
UPA Years vs NDA Years
(click image to enlarge)
(click image to enlarge)
(click image to enlarge)
Rs 5000 Per Month For A Family Of Five
(click image to enlarge)
Evidence for Chart 6:
Inclusive Growth, Spread Of The Middle Class
UPA Years(6.7 MWH, 2013) vs NDA Years (3.3 MWH, 2004)
(click image to enlarge)
(click image to enlarge)
(click image to enlarge)
(click image to enlarge)
Compared to 45 lakhs in Mar-2004
(click image to enlarge)
(click image to enlarge)
(click image to enlarge)
6.3 crore DTH TV Users in Dec 2013
(click image to enlarge)
(click image to enlarge)
From 2 crore in 1997 to 4.3 crore in 2003
(click image to enlarge)
From 4.3 crore in 2003 to 13.9 crore in 2013
(click image to enlarge)
(click image to enlarge)
to 6.3 crore in Dec 2013
(click image to enlarge)
and Disallowed It For Years
(click image to enlarge)
Cars: from 72 Lakhs in 2004 to 1.75 crore in 2012
Bikes: from 5.2 crores in 2004 to 11.5 crore in 2012
(click image to enlarge)
Manmohan added 38.5K
(click image to enlarge)
(click image to enlarge)
(click image to enlarge)
(click image to enlarge)
(click image to enlarge)
UPA Years vs NDA Years
(click image to enlarge)
(click image to enlarge)
NDA created 1.76 crore, UPA Created 10+ crore
(click image to enlarge)
From 5 Lakh Crore to 13 Lakh Crore
(click image to enlarge)
From 13 Lakh Crore to 61 Lakh Crore
(click image to enlarge)
Under Vajpayee @ 6.2% CAGR, From ~1 Lakh Crore to 1.4 Lakh Crore
Under Manmohan @ 20.5% CAGR, From 1.4 Lakh Crore to 9 Lakh Crore
(click image to enlarge)
(click image to enlarge)
Evidence for Chart 7:
Investor Confidence, Foreign Direct Investments
UPA Years (35% of GDP) vs NDA Years (25% of GDP)
(click image to enlarge)
NDA Years - 4 billion dollars per year, totalling 24 billion
UPA Years - 32 billion dollars per year, totalling 319 billion
(click image to enlarge)
NDA - 19.52 billion dollars
UPA-I - 114.55 biliion dollars
UPA-II -172.82 biliion dollars
(click image to enlarge)
UPA Also Attracted 144 billion dollars Of FII, versus NDA's 14 billion
(click image to enlarge)
Really Took Off From Year 2006
(click image to enlarge)
In The A. T. Kearney FDI Confidence Index
(click image to enlarge)
(click image to enlarge)
And Jobs Creation
(click image to enlarge)
(click image to enlarge)
Manmohan Years vs Vajpayee Years
(click image to enlarge)
(click image to enlarge)
Evidence for Chart 8: ElectricityInstalled Capacity, Power Generation and Consumption
Chart 8- Img 1- Power Generation From Utilities And Captive Plants
UPA Years vs NDA Years
(click image to enlarge)
(click image to enlarge)
Chart 8- Img 2- Power Generation From Utilities Apr-13 to Mar-14
(click image to enlarge)
Chart 8- Img 3- Power Generation From Utilities And Captive Plants
(2012-13)
(click image to enlarge)
(click image to enlarge)
Chart 8- Img 4- Addition To Installed Power Generation Capacity
(Utilities And Captive Plants)
UPA Years (15.34 GW/yr) vs NDA Years (4.85 GW/yr)
(click image to enlarge)
UPA Years (15.34 GW/yr) vs NDA Years (4.85 GW/yr)
(click image to enlarge)
Chart 8- Img 5- Growth Rates Of Installed Power Generation Capacity
UPA Years vs NDA Years
(click image to enlarge)
(click image to enlarge)
Chart 8- Img 6- Installed Power Generation Capacity As Of Apr-2014
Gross 285 GW, Of Which 13% From Renewable Sources (Wind,Solar...)
(click image to enlarge)
Chart 8- Img 7- Installed Power Capacity By Source Type
UPA Last Year(13% from renewable sources) vs
NDA Last Year (2% from renewable sources)
(click image to enlarge)
 Chart 8- Img 8- While Vajpayee's Last Year Saw 4.81 GW Of Power Capacity Installation, Each Of The Last Three Manmohan Years Have Seen Over 22 GW Addition
(click image to enlarge)
NDA Last Year (2% from renewable sources)
(click image to enlarge)
(click image to enlarge)
Chart 8- Img 9- Per Capita Consumption Of Electricity
UPA (917 KWH in 2012-13) vs NDA (390 KWH in 2003-04)
(click image to enlarge)
(click image to enlarge)
Chart 8- Img 10- Growth Trend In Per Capita Electricity Consumption
From 390 KWH in 2004 to 917 KWH in 2013
(click image to enlarge)
(click image to enlarge)
Chart 8- Img 11- Per Capita Domestic Electricity Consumption
From 83 KWH in 2004 to 202 KWH in 2013
(click image to enlarge)
 Chart 8- Img 12- Sectorwise Electricity Consumption in 2012-13
(At 22% Of Total, Domestic Per Capita Consumption is
917*0.22=202 KWH)
(click image to enlarge)
 Chart 8- Img 13- Percentage Of Villages Electrified
Planwise Until 2004 (83.33% in 2004 versus 84.55% in 1998)
(click image to enlarge)
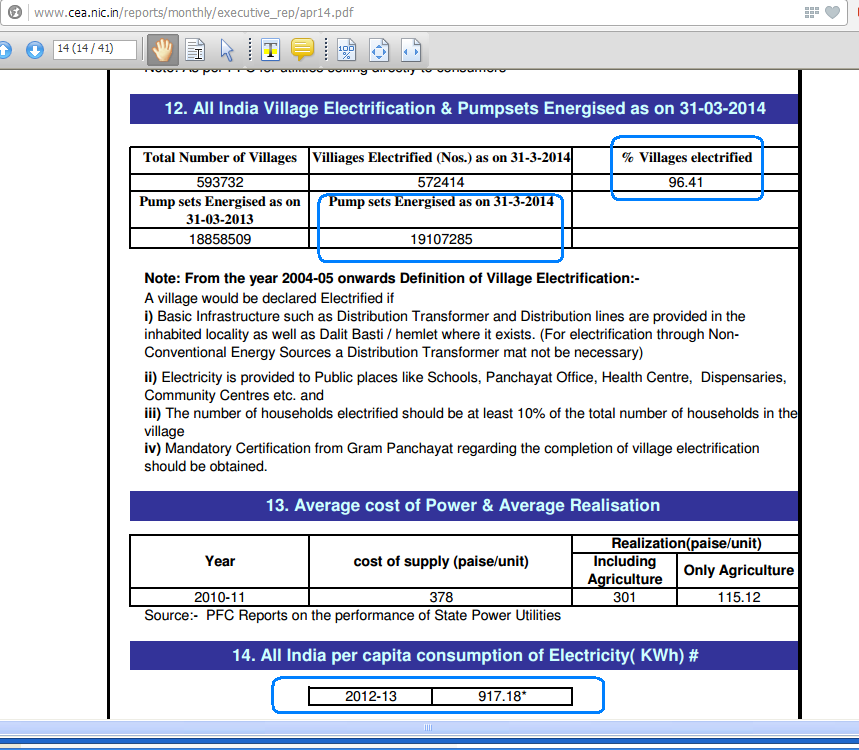 Chart 8- Img 14- 96.4% Of All Villages Electrified By Mar-2014
(click image to enlarge)
 Chart 8- Img 15- Growth In Electric Pumpsets For Irrigation
UPA Years (Avg 5.2 lakhs/yr) vs NDA Years (Avg 3.8 lakhs/yr)
(click image to enlarge)
 Chart 8- Img 16- Power Supply Deficits
UPA Years (Avg 9.11%) vs NDA Years (Avg 7.23%)
2% Higher Power Deficit, After 2.35-fold Jump In Per Capita Consumption
(click image to enlarge)
 Chart 8- Img 17- BPL Households Getting 90% Subsidized Power Connection Under Grameen Vidyutikaran Yojana
1.94 crore By Mar-2012 vs 6.5 lakh In 2005-06
(click image to enlarge)
 Chart 8- Img 18- 2.15 Crore BPL Households Get 90% Subsidized Power Connection Under Grameen Vidyutikaran Yojana, By Dec-2013
(click image to enlarge)

 Chart 9- Img 2- Infrastructure Spending Increased From About 4.5% GDP Under Vajpayee To 8.4% Of GDP Under Manmohan
(click image to enlarge)
 Chart 9- Img 3- Relative Emphasis On Infrastructure
Between The 10th Plan (2002-07) and The 11th Plan (2007-12)
(click image to enlarge)
 Chart 9- Img 4- Infrastructure Budget Has Grown Six Fold
From 9 Lakh Crore in The 10th Plan to 56 Lakh Crore in The 12th Plan
(click image to enlarge)
 Chart 9- Img 5- Planwise Growth In Infrastructure Spending
(click image to enlarge)
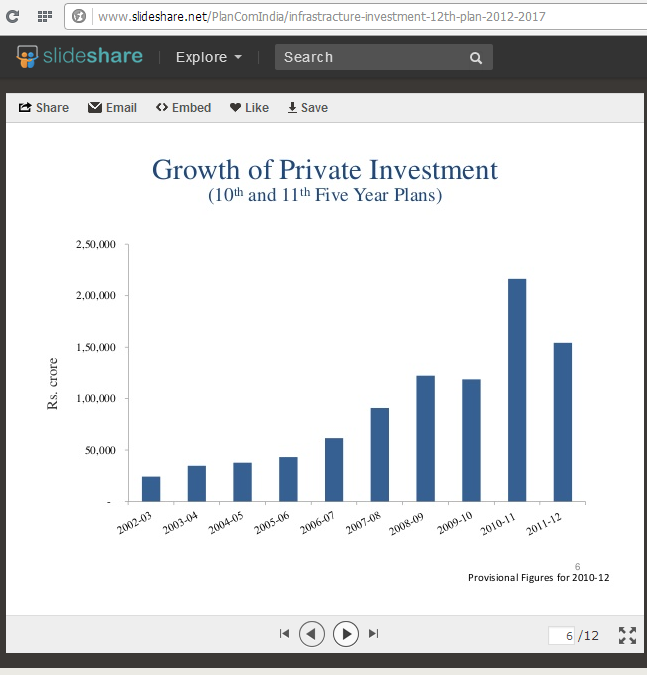
Chart 9- Img 6- UPA's Major Contribution Was To Boost Private Sector Investments In Infrastructure
(click image to enlarge)
 Chart 9- Img 7- Share Of Private Sector Spending In Infrastructure Grew From 22% In The 10th Plan To 38% in the 11th Plan
(click image to enlarge)
 Chart 9- Img 8- Share Of Private Sector Spending In Infrastructure Grew From 38% In The 11th Plan To 47% in the 12th Plan
(click image to enlarge)

Chart 9- Img 9- World Bank Ranks India As The Predominant Player In Private Participation In Infrastructure in 2011
(click image to enlarge)
 Chart 9- Img 10- India Ranks Second In Terms Of Both Number Of Projects And Investments Made By Private Sector In Infrastructure between 1990-2012
(click image to enlarge)
 Chart 9- Img 11- Private Investments Into Infrastructure Per Year
NDA: 4.94 Billion Dollars Per Year
UPA: 32.8 Billion Dollars Per Year
(click image to enlarge)
 Chart 9- Img 12- Year And Sector Wise Private Investments In Infrastructure, UPA Years vs NDA Years
(click image to enlarge)
 Chart 9- Img 13- UPA Planned A Trillion Dollar Investment Into Infrastructure With One-Third Going To Power Generation
(click image to enlarge)
 Chart 9- Img 14- Investments Into Infrastructure, Planned vs Actual
2007-2012
(click image to enlarge)
 Chart 9- Img 15- Paved Rural Roads Built Under
Pradhan Mantri Gram Sadak Yojana
By NDA (Dec-2000 to May-2004)
New Roads : 29,664 km
Upgraded Roads: 20,220 km
(click image to enlarge)
 Chart 9- Img 16- Paved Rural Roads Built Under
Pradhan Mantri Gram Sadak Yojana
By UPA (May-2004 to May-2014)
New Roads: 212,817 km
Upgraded Roads: 142,673 km
(click image to enlarge)
 Chart 9- Img 17- Length Of National Highways in Mid-1998: 49,600 km
(click image to enlarge)
 Chart 9- Img 18- Length Of National Highways in Mar-2004: 65,569 km
Vajpayee Added (65,569-49,600) = 15,969 km in six years
(click image to enlarge)
 Chart 9- Img 19- Length Of National Highways in April-2014: 82,621 km
Manmohan Added (82,621-65,569) = 17,052 km in ten years
(click image to enlarge)

Chart 9- Img 20- Length Of National Highways 4/6 Laned
In Mar-2004: 3409 km (zero in 1998)
Vajpayee 'Handled' 3409 km of 4/6 Laned National Highways In Six Years
Of Which Golden Quadrilateral: 2612 km
NSEW Corridor: 588 km
(click image to enlarge)
 Chart 9- Img 21- Length Of National Highways 4/6 Laned
In Mar-2014: 22,365 km
Manmohan Built 18,956 km of 4/6 Laned National Highways In Ten Years
Of Which Golden Quadrilateral (5846-1836)=4010km
NSEW Corridor: (6282-588)= 5694 km
(click image to enlarge)
 Chart 9- Img 22- As Per CAG, Vajpayee Completed Only 1846 km Of National Highways Under NHDP Until Jun-2004
(Even Vajpayee's Claim Was That 3409 km Was 'Handled' not 'Completed')
(click image to enlarge)
 Chart 9- Img 23-Year-Wise Financing Of
National Highways Development Programme (NHDP)
UPA Years vs NDA Years
(click image to enlarge)
 Chart 9- Img 24-Number Of Projects And Length Of National Highways Awarded Under Public-Private-Partnership (PPP) Model
UPA Years vs NDA Years
(click image to enlarge)
 Chart 9- Img 25-UPA Launched The Master Plan For Building 18637 km Of Greenfield Expressways By 2022
(click image to enlarge)
 Chart 9- Img 26-Around The Country 44 Expressways To Be Built Through PPP Mode By 2022 At A Cost Of Over 3 Lakh Crore In Three Phases
(click image to enlarge)
 Chart 9- Img 27-UPA Approved Metro Rail For All Cities With 2 Million+ Population
(click image to enlarge)
 Chart 9- Img 28-Metro Rails Transforming Indian Cities
(click image to enlarge)
 Chart 9- Img 28- Two Metro Rails Already Gone Live Under UPA (Bangalore, Gurgaon), Seven Others Under Rapid Construction
(click image to enlarge)
 Chart 9- Img 29-Vajpayee Launched 2 Lines Of Delhi Metro, Manmohan Launched 3 Other Lines + Airport Express
(click image to enlarge)
 Chart 9- Img 30-Metro Rails Under Planning In Fifteen Other Cities
(click image to enlarge)
 Chart 9- Img 31-Mumbai Monorail Already Gone Live, Kozhikode Under Construction, 14 Other Monorail Projects Under Planning
(click image to enlarge)
 Chart 9- Img 32-Progress Of Several Metro Rail Projects
(click image to enlarge)
 Chart 9- Img 33-Metro Rail Coach, Engine And Equipment Companies Make A Beeline For India
(click image to enlarge)
 Chart 9- Img 34-Bus Rapid Transit Systems Were Launched In 9 Cities Under UPA, 14 Others Under Construction/Planning
(click image to enlarge)
 Chart 9- Img 35- Eastern And Western Dedicated Railway Freight Corridors Under Construction, covering 3300 km
(click image to enlarge)
 Chart 9- Img 36-Dedicated Freight Corridors, Route-Maps And Implementation Periods
(click image to enlarge)
 Chart 9- Img 37-Investment Mix Between Public And Private Sector
10th, 11th and 12th Plans
(click image to enlarge)
 Chart 9- Img 38-UPA Increased Infrastructure Investments Four Fold
From 1.23 Lakh Crore (in 2003-04) to 4.89 Lakh Crore (in 2011-12)
Five-Fold Greater Investments in Roads Compared To Vajpayee
From 21.9K Crore To Over 1 Lakh Crore
(click image to enlarge)
 Chart 9- Img 39-At Constant Prices (i.e. Discounting Inflation), Investments In Infrastructure Grew 2.5 Fold From 2003-04 to 2011-12
Private Investments Grew 7-Fold
(click image to enlarge)
 Chart 9- Img 40-As Per The World Bank PPI Database
India Was The Largest Recipient Of Private Investments In Infrastructure
During UPA Years (2005-2011), Ahead Of China And Brazil
(click image to enlarge)
 Chart 9- Img 41-Projected Investments In Roads, Highways And Expressways 2012-2032
(click image to enlarge)
 Chart 9- Img 42-Railway Infrastructure Projects Worth Rs 7300 crore Commissioned in 2013-14
(click image to enlarge)

(click image to enlarge)
 Chart 10- Img 2-Airports Authority Completes Upgrades Of 28 of 35 Non-Metro Airports Chosen In 2012-13
(click image to enlarge)
 Chart 10- Img 3-India Got Four World Class Airports Under UPA- Delhi, Hyderabad, Bangalore, Mumbai, Ranked Among The Best In The World
(click image to enlarge)
 Chart 10- Img 4-Delhi Airport Terminal 3 Started Construction on Feb 2007 and Went Live in 37 Months In Mar-2010
(click image to enlarge)

Chart 10- Img 5-Hyderabad International Airport Foundation Stone Laid Mar-2005 and Goes Live in Mar-2008, in Record 36 Months
(click image to enlarge)

Chart 10- Img 6-Bangalore International Airport Terminal 1A Inaugurated In Dec-2013 Is The Third Largest In India, and Ranks Among The Best In The World
(click image to enlarge)
 Chart 10- Img 7-Mumbai's Chhatrapati Shivaji Airport Terminal 2 Is An Architectural Marvel, With a 3 km Long Art Wall, and Bigger Than Singapore Changi T3 and London Heathrow T5,
With a 4 Crore Annual Capacity
(click image to enlarge)
 Chart 10- Img 8-Hyderabad, Delhi Airports Have Topped International Rankings In Their Respective Categories
(click image to enlarge)
 Chart 10- Img 9-UPA Launched Upgradations Of 35+ Non-Metro Airports Too in Jun-2006, And Completed 28 By Dec-2012
(click image to enlarge)
 Chart 10- Img 10-KPMG Recognizes UPA's Airports Building Work As Game-Changing For Logistics
(click image to enlarge)
 Chart 10- Img 11-Vajpayee Had "Planned" New Airports At Bangalore And Hyderabad From 1999 Itself. Never Got Any Construction To Start In His Next Five Years Of Tenure. Also Had No Money For The Kochi Airport, Which NRIs and The Kerala Government Pooled Resources To Build On Their Own
(click image to enlarge)
 Chart 10- Img 12-Vajpayee Had Instructed In His 10th Plan (2002-07) That "No New Airports Should Be Opened Without Government Approval" Because Apparently There Were No Flights Landing Anyway...!
(click image to enlarge)
 Chart 10- Img 13-As Per KPMG, Manmohan Increased Airports Building Investments From 6900 Crore In The Tenth Plan (2002-07) To 67500 Crore in The Twelfth Plan (2012-17) -- Almost Ten Fold Jump, With 75% Of It Coming From The Private Sector
(click image to enlarge)
 Chart 10- Img 14-India Had 1.66 Crore International And 3.21 Crore Domestic Air Passengers in 2003-04
(click image to enlarge)
 Chart 10- Img 15-India Had 4.25 Crore International And 11.2 Crore Domestic Air Passengers in 2013-14. International Passengers Grew 2.5 Fold From Vajpayee's Last Year And Domestic Passengers Grew 3.5 Fold
(click image to enlarge)
 Chart 10- Img 16-Growth In Passenger Throughput At Indian Airports (1995-2012)
(click image to enlarge)
 Chart 10- Img 17-Growth In Cargo Throughput At Indian Airports
(1995-2012)
(click image to enlarge)
 Chart 10- Img 18-Growth In Shipping Fleet And Tonnage
UPA Years vs NDA Years
 Chart 10- Img 20-Despite Significant Growth, India's Shipping Capacity Is Grossly Inadequate To Meet Needs
(click image to enlarge)
 Chart 10- Img 21-Vajpayee Launched 11 Satellites In Six Years,
Of Which Six Launched From Indian Pads
(click image to enlarge)
 Chart 10- Img 22-Manmohan Launched 14 Satellites In His First Five Years, Of Which 12 From India
(click image to enlarge)
 Chart 10- Img 23-Manmohan Launched 35 Satellites In His Tenure Of Ten Years (Of Which 29 From India). India Sent Missions To Moon And Mars, And Mastered Cryogenic Engines
(click image to enlarge)
 Chart 10- Img 24-India Already Launched Two Of Seven IRNSS Satellites. Indigenous GPS To Be Operational From 2016
(click image to enlarge)

(click image to enlarge)

(click image to enlarge)
 Chart 11- Img 3-Growth In Electronics Production (All Types) In India Under Vajpayee (98-99 to 03-04): 12% CAGR
(click image to enlarge)
 Chart 11- Img 4-Growth In Electronics Production (All Types) In India Under Manmohan (03-04 to 12-13): 16.8% CAGR
(click image to enlarge)
 Chart 11- Img 5-Electronics Hardware Production Under Manmohan Quadrupled From 0.44 Lakh Crore (03-04) to 1.78 Lakh Crore (12-13)
(click image to enlarge)

(click image to enlarge)

(click image to enlarge)
 Chart 11- Img 8-In 2013, India Was The Fourth Largest Producer Of Steel In The World, As Per The World Steel Association
(click image to enlarge)
 Chart 11- Img 9-Growth In Fabrics Production In India
Under Vajpayee (97-98 to 03-04): 2.1% CAGR
(click image to enlarge)
 Chart 11- Img 10-Growth In Fabrics Production In India
Under Manmohan (03-04 to 12-13): 4.5% CAGR
(click image to enlarge)
 Chart 11- Img 11-Growth In Petroleum Products Production In India
Under Vajpayee (97-98 to 03-04): 11% CAGR
(With Average Crude Oil Prices Of $23 Per Barrel)
(click image to enlarge)
 Chart 11- Img 12-Growth In Petroleum Products Production In India
Under Manmohan (03-04 to 12-13): 7.5% CAGR
(With Average Crude Oil Prices Of $78 Per Barrel)
(click image to enlarge)
 Chart 11- Img 13-Growth In Cement Production In India
Under Vajpayee (97-98 to 03-04): 7% CAGR
(click image to enlarge)
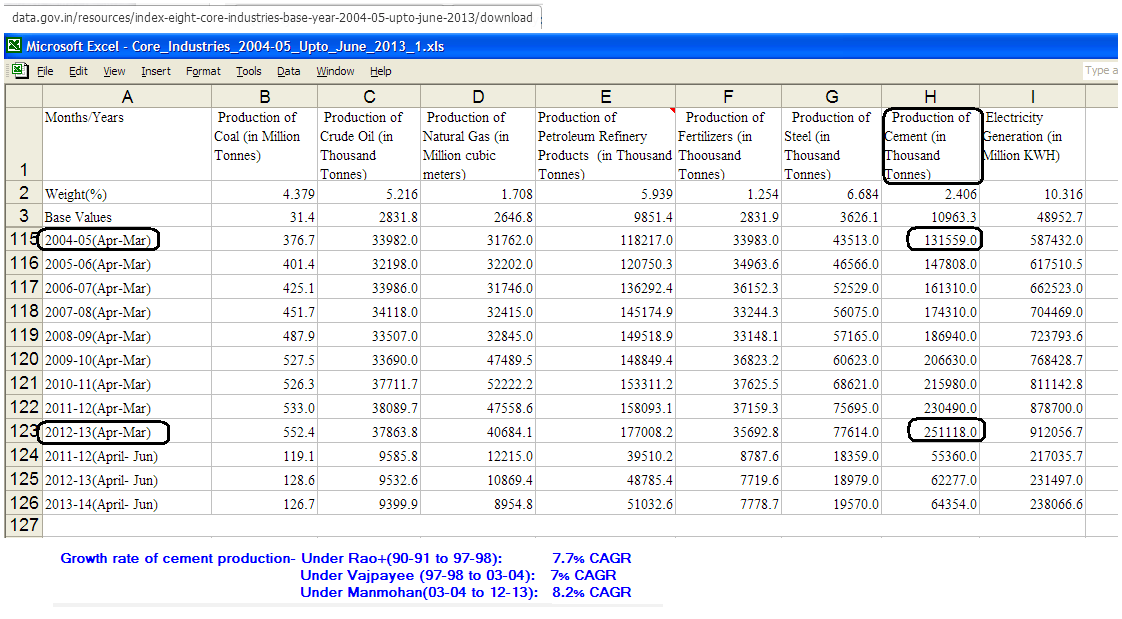 Chart 11- Img 14-Growth In Cement Production In India
Under Manmohan (03-04 to 12-13): 8.2% CAGR
(click image to enlarge)
 Chart 11- Img 15-Growth In Software Production In India
Under Vajpayee (99-00 to 03-04): 32.4% CAGR
(Against a low base, since those were nascent years of the industry)
(click image to enlarge)
 Chart 11- Img 16-Growth In Software Production In India
Under Manmohan (03-04 to 12-13): 24% CAGR
(click image to enlarge)
 Chart 11- Img 16-Growth In Software Production In India 2007-2013
(click image to enlarge)
 Chart 11- Img 17-As Per NASSCOM, IT Industry Grew To Rs 639,671 Crore In 2013-14, Up From Rs 74,490 Crore In 2003-04
An 8.5 Fold Jump Under Manmohan
(click image to enlarge)
 Chart 11- Img 18-Growth In Gems & Jewellery Exports In India
Under Vajpayee (97-98 to 03-04): 13.9% CAGR
 Chart 11- Img 19-Growth In Gems & Jewellery Exports In India
Under Manmohan (03-04 to 13-14): 11% CAGR
(click image to enlarge)
 Chart 11- Img 20-Growth In Pharma Exports In India
Under Vajpayee (97-98 to 03-04): 19% CAGR

Chart 11- Img 21-Growth In Pharma Exports In India
Under Manmohan (03-04 to 13-14): 19.5% CAGR
(click image to enlarge)
 Chart 11- Img 22-Growth In Biotechnology Industry In India
Under Manmohan (03-04 to 12-13): 23.7% CAGR
(click image to enlarge)
 Chart 11- Img 23-UPA's 10-Fold Increase In Budgetary Allocations To Biotech (From 1450 crore in 10th Plan To 15000 Crore In The 12th Plan)
Led To Setting Up Of Over 26 Biotech Parks All Over India
(click image to enlarge)
 Chart 11- Img 24-Size Of Indian Processed Food And Beverages Industry Under Vajpayee (2003-04): Rs 1.59 lakh crore
 Chart 11- Img 25-Size Of Indian Processed Food And Beverages Industry Under Manmohan (2011-12): Rs 7.01 lakh crore
 Chart 11- Img 26-Size Of Indian Processed Food And Beverages Industry Under Manmohan (2013-14): Rs 9.53 lakh crore ($156 billion)
Growth rate (2003-04 to 2013-14): 19.6% CAGR
Expected Size By FY2015: Rs 12.2 lakh crore ($200 billion)
 Chart 11- Img 27-FDI In Food Processing Grew 11-Fold Under Manmohan, From 201 crores in 2004-05 to 2194 crore in 2012-13
 Chart 11- Img 28-Funds Allocated For Food Processing Infrastructure Development Grew 29 Times Under Manmohan
As Per FICCI-KPMG Report 2013
From $37.5 million in 10th Plan (2002-07)
to $1088.5 million in 12th Plan (2012-17)
 Chart 11- Img 29-UPA's Initiative Saw The Launch Of Mega Food Parks

Chart 11- Img 30-Over 30 Mega Food Parks Are Coming Up All Over The Country, Boosting The Food Processing Industry And Employment
 Chart 11- Img 31-Size Of The Media And Entertainment Industry In India
Under Vajpayee (in Dec-2003): Rs 19600 Crore
 Chart 11- Img 32-Size Of The Media And Entertainment Industry In India
Under Manmohan (in Dec-2013): Rs 91800 Crore
Media Industry Grew Almost 5 Fold Under UPA
(And Virtually Proved To Be Their Undoing!)
 Chart 11- Img 33-Foreign Tourist Arrivals In India
During Vajpayee Years (1998-2003): Average 25.26 Lakhs Per Year
During Manmohan Years (2004-2013): Average 59.45 Lakhs Per Year
 Chart 11- Img 34-Foreign Tourist Arrivals In India In 2013: 68.48 Lakhs
Foreign Exchange Earnings From Tourism In India In 2013: $18.13 Billion
 Chart 11- Img 35-Foreign Exchange Earnings Through Tourism In India
During Vajpayee Years (1998-2003): Average $3.36 Billion Per Year
During Manmohan Years (2004-2013): Average $12.26 Billion Per Year
 Chart 11- Img 37-As Per Deloitte And US Council On Competitiveness
India Ranked 4th In The World In Global Manufacturing Competitiveness Index (GMCI) In 2013
 Chart 11- Img 38-Manufactured Goods Export From India Grew At 17.4% CAGR Between 2005-2012
 Chart 12- Img 1-Growth In National Research & Development Expenditure
UPA Years (17.5% CAGR) vs NDA Years (11.4% CAGR)
 Chart 12- Img 2-Transparency International Corruption Perception Score
(100 is cleanest)
UPA Years (33.44) vs NDA Years (27.5)
 Chart 12- Img 3-Improvement In Transparency International
Corruption Perception Index Score (100 is Cleanest)
Under Vajpayee: 1 Point in 4 Years
Under Manmohan: 8 Points in 10 Years
 Chart 12- Img 4-World Ranking In Transparency International
Corruption Perception Index Score (1 is Cleanest)
Under Vajpayee: 19 Slots Decline in 3 Years
Under Manmohan: 4 Slots Decline in 10 Years
While India Declined 4 slots, China Declined 9, Brazil 13, South Africa 28 and Russia Declined 37 slots
 Chart 12- Img 5-Average Number Of Persons Killed In Terrorist Incidents
In Jammu & Kashmir
Under Vajpayee: 901 Civilians And 382 Security Personnel Killed Per Year
 Chart 12- Img 6-Average Number Of Persons Killed In Terrorist Incidents
In Jammu & Kashmir
Under Manmohan (UPA-II): 36 Civilians And 42 Security Personnel Killed Per Year

(click image to enlarge)
(click image to enlarge)
(At 22% Of Total, Domestic Per Capita Consumption is
917*0.22=202 KWH)
(click image to enlarge)
Planwise Until 2004 (83.33% in 2004 versus 84.55% in 1998)
(click image to enlarge)
(click image to enlarge)
UPA Years (Avg 5.2 lakhs/yr) vs NDA Years (Avg 3.8 lakhs/yr)
(click image to enlarge)
UPA Years (Avg 9.11%) vs NDA Years (Avg 7.23%)
2% Higher Power Deficit, After 2.35-fold Jump In Per Capita Consumption
(click image to enlarge)
1.94 crore By Mar-2012 vs 6.5 lakh In 2005-06
(click image to enlarge)
(click image to enlarge)
Evidence for Chart 9: Infrastructure DevelopmentRoads, Railways, Metro Rail
Chart 9- Img 1- Infrastructure Spending As A Percent Of GDP And In Absolute Terms (At Constant Prices, i.e. After Inflation)
UPA Years vs NDA Years
(click image to enlarge)
(click image to enlarge)
(click image to enlarge)
Between The 10th Plan (2002-07) and The 11th Plan (2007-12)
(click image to enlarge)
From 9 Lakh Crore in The 10th Plan to 56 Lakh Crore in The 12th Plan
(click image to enlarge)
(click image to enlarge)
Chart 9- Img 6- UPA's Major Contribution Was To Boost Private Sector Investments In Infrastructure
(click image to enlarge)
(click image to enlarge)
(click image to enlarge)
Chart 9- Img 9- World Bank Ranks India As The Predominant Player In Private Participation In Infrastructure in 2011
(click image to enlarge)
(click image to enlarge)
NDA: 4.94 Billion Dollars Per Year
UPA: 32.8 Billion Dollars Per Year
(click image to enlarge)
(click image to enlarge)
(click image to enlarge)
2007-2012
(click image to enlarge)
Pradhan Mantri Gram Sadak Yojana
By NDA (Dec-2000 to May-2004)
New Roads : 29,664 km
Upgraded Roads: 20,220 km
(click image to enlarge)
Pradhan Mantri Gram Sadak Yojana
By UPA (May-2004 to May-2014)
New Roads: 212,817 km
Upgraded Roads: 142,673 km
(click image to enlarge)
(click image to enlarge)
Vajpayee Added (65,569-49,600) = 15,969 km in six years
(click image to enlarge)
Manmohan Added (82,621-65,569) = 17,052 km in ten years
(click image to enlarge)
Chart 9- Img 20- Length Of National Highways 4/6 Laned
In Mar-2004: 3409 km (zero in 1998)
Vajpayee 'Handled' 3409 km of 4/6 Laned National Highways In Six Years
Of Which Golden Quadrilateral: 2612 km
NSEW Corridor: 588 km
(click image to enlarge)
In Mar-2014: 22,365 km
Manmohan Built 18,956 km of 4/6 Laned National Highways In Ten Years
Of Which Golden Quadrilateral (5846-1836)=4010km
NSEW Corridor: (6282-588)= 5694 km
(click image to enlarge)
(Even Vajpayee's Claim Was That 3409 km Was 'Handled' not 'Completed')
(click image to enlarge)
National Highways Development Programme (NHDP)
UPA Years vs NDA Years
(click image to enlarge)
UPA Years vs NDA Years
(click image to enlarge)
(click image to enlarge)
(click image to enlarge)
(click image to enlarge)
(click image to enlarge)
(click image to enlarge)
(click image to enlarge)
(click image to enlarge)
(click image to enlarge)
(click image to enlarge)
(click image to enlarge)
(click image to enlarge)
(click image to enlarge)
(click image to enlarge)
10th, 11th and 12th Plans
(click image to enlarge)
From 1.23 Lakh Crore (in 2003-04) to 4.89 Lakh Crore (in 2011-12)
Five-Fold Greater Investments in Roads Compared To Vajpayee
From 21.9K Crore To Over 1 Lakh Crore
(click image to enlarge)
Private Investments Grew 7-Fold
(click image to enlarge)
India Was The Largest Recipient Of Private Investments In Infrastructure
During UPA Years (2005-2011), Ahead Of China And Brazil
(click image to enlarge)
(click image to enlarge)
(click image to enlarge)
Evidence for Chart 10: Infrastructure DevelopmentAirports, Ports, Communication Satellites
Chart 10- Img 1-Major Boost To Airports Building Under UPA
9 International Airports, 35+ Non-Metro Airports
(click image to enlarge)
(click image to enlarge)
(click image to enlarge)
(click image to enlarge)
Chart 10- Img 5-Hyderabad International Airport Foundation Stone Laid Mar-2005 and Goes Live in Mar-2008, in Record 36 Months
(click image to enlarge)
Chart 10- Img 6-Bangalore International Airport Terminal 1A Inaugurated In Dec-2013 Is The Third Largest In India, and Ranks Among The Best In The World
(click image to enlarge)
With a 4 Crore Annual Capacity
(click image to enlarge)
(click image to enlarge)
(click image to enlarge)
(click image to enlarge)
(click image to enlarge)
(click image to enlarge)
(click image to enlarge)
(click image to enlarge)
(click image to enlarge)
(click image to enlarge)
(1995-2012)
(click image to enlarge)
UPA Years vs NDA Years
(click image to enlarge)

Chart 10- Img 19-Containerized Cargo Traffic At Indian Ports Increased From 4 Million TEUs in 2004 To 14 Million TEUs In 2014 -- A 3.5 Fold Jump
(click image to enlarge)
Chart 10- Img 19-Containerized Cargo Traffic At Indian Ports Increased From 4 Million TEUs in 2004 To 14 Million TEUs In 2014 -- A 3.5 Fold Jump
(click image to enlarge)
(click image to enlarge)
Of Which Six Launched From Indian Pads
(click image to enlarge)
(click image to enlarge)
(click image to enlarge)
(click image to enlarge)
Evidence for Chart 11: Industrial Growth
Chart 11- Img 1-Growth In Automobile Production (All Types) In India Under Vajpayee (97-98 to 03-04): 10.5% CAGR
(click image to enlarge)
Chart 11- Img 2-Growth In Automobile Production (All Types) In India Under Manmohan (03-04 to 12-13): 12.4% CAGR
(click image to enlarge)
(click image to enlarge)
(click image to enlarge)
(click image to enlarge)
Chart 11- Img 6-Growth In Finished Steel Production In India
Under Vajpayee (97-98 to 03-04): 7.2% CAGR
Under Vajpayee (97-98 to 03-04): 7.2% CAGR
(click image to enlarge)
Chart 11- Img 7-Growth In Finished Steel Production In India
Under Manmohan (03-04 to 12-13): 8.6% CAGR
Under Manmohan (03-04 to 12-13): 8.6% CAGR
(click image to enlarge)
(click image to enlarge)
Under Vajpayee (97-98 to 03-04): 2.1% CAGR
(click image to enlarge)
Under Manmohan (03-04 to 12-13): 4.5% CAGR
(click image to enlarge)
Under Vajpayee (97-98 to 03-04): 11% CAGR
(With Average Crude Oil Prices Of $23 Per Barrel)
(click image to enlarge)
Under Manmohan (03-04 to 12-13): 7.5% CAGR
(With Average Crude Oil Prices Of $78 Per Barrel)
(click image to enlarge)
Under Vajpayee (97-98 to 03-04): 7% CAGR
(click image to enlarge)
Under Manmohan (03-04 to 12-13): 8.2% CAGR
(click image to enlarge)
Under Vajpayee (99-00 to 03-04): 32.4% CAGR
(Against a low base, since those were nascent years of the industry)
(click image to enlarge)
Under Manmohan (03-04 to 12-13): 24% CAGR
(click image to enlarge)
(click image to enlarge)
An 8.5 Fold Jump Under Manmohan
(click image to enlarge)
Under Vajpayee (97-98 to 03-04): 13.9% CAGR
(click image to enlarge)
Under Manmohan (03-04 to 13-14): 11% CAGR
(click image to enlarge)
Under Vajpayee (97-98 to 03-04): 19% CAGR
(click image to enlarge)
Chart 11- Img 21-Growth In Pharma Exports In India
Under Manmohan (03-04 to 13-14): 19.5% CAGR
(click image to enlarge)
Under Manmohan (03-04 to 12-13): 23.7% CAGR
(click image to enlarge)
Led To Setting Up Of Over 26 Biotech Parks All Over India
(click image to enlarge)
(click image to enlarge)
(click image to enlarge)
Growth rate (2003-04 to 2013-14): 19.6% CAGR
Expected Size By FY2015: Rs 12.2 lakh crore ($200 billion)
(click image to enlarge)
(click image to enlarge)
As Per FICCI-KPMG Report 2013
From $37.5 million in 10th Plan (2002-07)
to $1088.5 million in 12th Plan (2012-17)
(click image to enlarge)
(click image to enlarge)
Chart 11- Img 30-Over 30 Mega Food Parks Are Coming Up All Over The Country, Boosting The Food Processing Industry And Employment
(click image to enlarge)
Under Vajpayee (in Dec-2003): Rs 19600 Crore
(click image to enlarge)
Under Manmohan (in Dec-2013): Rs 91800 Crore
Media Industry Grew Almost 5 Fold Under UPA
(And Virtually Proved To Be Their Undoing!)
(click image to enlarge)
During Vajpayee Years (1998-2003): Average 25.26 Lakhs Per Year
During Manmohan Years (2004-2013): Average 59.45 Lakhs Per Year
(click image to enlarge)
Foreign Exchange Earnings From Tourism In India In 2013: $18.13 Billion
(click image to enlarge)
During Vajpayee Years (1998-2003): Average $3.36 Billion Per Year
During Manmohan Years (2004-2013): Average $12.26 Billion Per Year
(click image to enlarge)
 Chart 11- Img 36-Growth In Index Of Industrial Production (IIP)
Of Major Industries
During UPA Years (Apr-2005 To Feb-2014)
Radio, TV, Communication Equipment, Electrical Machinery, Consumer Durables Top The List
Of Major Industries
During UPA Years (Apr-2005 To Feb-2014)
Radio, TV, Communication Equipment, Electrical Machinery, Consumer Durables Top The List
(click image to enlarge)
India Ranked 4th In The World In Global Manufacturing Competitiveness Index (GMCI) In 2013
(click image to enlarge)
(click image to enlarge)
 Chart 11- Img 39-Manufacturing GDP Growth Rates And Employment By Sectors, During 11th Plan (2007-12)
(click image to enlarge)
Evidence for Chart 12:
Research And Development, Corruption, Internal Security
UPA Years (17.5% CAGR) vs NDA Years (11.4% CAGR)
(click image to enlarge)
(100 is cleanest)
UPA Years (33.44) vs NDA Years (27.5)
(click image to enlarge)
Corruption Perception Index Score (100 is Cleanest)
Under Vajpayee: 1 Point in 4 Years
Under Manmohan: 8 Points in 10 Years
(click image to enlarge)
Corruption Perception Index Score (1 is Cleanest)
Under Vajpayee: 19 Slots Decline in 3 Years
Under Manmohan: 4 Slots Decline in 10 Years
While India Declined 4 slots, China Declined 9, Brazil 13, South Africa 28 and Russia Declined 37 slots
(click image to enlarge)
In Jammu & Kashmir
Under Vajpayee: 901 Civilians And 382 Security Personnel Killed Per Year
(click image to enlarge)
In Jammu & Kashmir
Under Manmohan (UPA-II): 36 Civilians And 42 Security Personnel Killed Per Year
(click image to enlarge)
 Chart 12- Img 7-Average Number Of Persons Killed In Terrorist Incidents
All India
Under Vajpayee: 1509 Civilians And 640 Security Personnel Killed Per Year (Maoist Deaths Extra)
Under Manmohan (UPA-II): 515 Civilians And 266 Security Personnel Killed Per Year (Maoist Deaths Included)
All India
Under Vajpayee: 1509 Civilians And 640 Security Personnel Killed Per Year (Maoist Deaths Extra)
Under Manmohan (UPA-II): 515 Civilians And 266 Security Personnel Killed Per Year (Maoist Deaths Included)
(click image to enlarge)
Wrapping Up!