After looking at the illustrious claims regarding building of national highways and the Golden Quadrilateral, let's now consider the third trumpet that the NDA likes to blow. By the end of this post, we'll know what's the truth behind the NDA's claims of bringing about a "jobs revolution" during 1998-2004, compared to the alleged disastrous performance of the UPA on that score. Once again, we'll refer to official and authentic documents published by the Government of India, and other statutory bodies to discover the truth behind the ceaseless propaganda being carried out on every conceivable forum.
As usual, let's begin with a survey of some of the claims made by some Modi luminaries.
What do Modi's men like to claim...?
Here's the BJP's ex-Finance-Minister, Mr Yashwant Sinha asserting (on 24-Sep-2013):
Here is BJP Deputy Leader in Rajya Sabha, Mr Ravi Shankar Prasad fulminating (on 30-Mar-2014) that under an economist PM, the UPA has destroyed the entire economy and suggesting that the NDA had created jobs through great management of industrial production and manufacturing:
Here is BJP National Treasurer Piyush Goyal declaring:
Here is BJP national spokesperson, the eminent Mr Prakash Javadekar (we discussed his suggestion of NDA having completed 90% of the Golden Quadrilateral in my previous post) claiming:
By the way, the great Mr Javadekar also challenged the PM to hold a debate on the economy. With him...? -- I'm sure that must have left Manmohan Singh squirming. Anyway, in the absence of MMS joining the debate, I hope this post will try to fill in on the subject!)
And, last but not the least, here is the official BJP document (dated 25-Feb-2014) on the "golden legacy" of Shri Atal Bihari Vajpayee (remember, he of 50% national highways and "Golden" Quadrilateral fame...?) proclaiming that "Vajpayee created 58 million more jobs than UPA-1". (Don't you find it somewhat surprising that the BJP should try to compare itself with UPA-1, when UPA-2 itself is at the end of its tenure...? But we'll leave that for later...)


So, there I go...! Didn't I just give the BJP ammunition...? Now all the BJP propagandists, who never knew where those figures of sixty million jobs actually came from, can claim that what they were speaking was nothing but the truth. I have just self-contradicted my own take, and instead added grist to the BJP's mill...! I have just given their claims legitimacy, that they themselves were never quite aware of. Haven't I just proved with official data that the NDA did actually create sixty million jobs...? Or have I...?
Well, the answer is: it's not so simple.
Have you ever heard of a bikini...? You have, right...? I'm sure you have. Have you also heard what they say of a bikini...? -- It hides more than it reveals.
The question that one should first ask is: what qualifies as a job, and how does one count the number of jobs that are present...?
Well, we have all heard of the US publishing "jobs data" on a regular basis (monthly, in fact), and that piece of information is published worldwide and shakes stock markets across the globe. For example, this month's report shows that the US added 192,000 jobs in March 2014 and the unemployment rate was at 6.7%. Let's consider how the US arrives at those figures. Here is what the report by the US Bureau of Labor Statistics shows:

So, how does the US arrive at this figure...? Well, look closely at the image and you'll know. The US does so by looking at "payrolls", that too for non-farm sectors. In the US most payrolls are processed by payroll service bureaus (like ADP), which handle taxes, process paychecks, and feed data back to the Bureau of Labor Statistics, all tied to SSN numbers, which is how they manage to publish monthly how many jobs got added or subtracted.
Well, the US is fortunate to have it all packed up nicely through the SSN. Does India have something that serves an equal purpose...? Well, we don't have an SSN to track job payrolls, but we do have one thing which is close. It's the Provident Fund Number, which every person holding a "job" in any organization employing 20 or more people is mandated by law to possess.
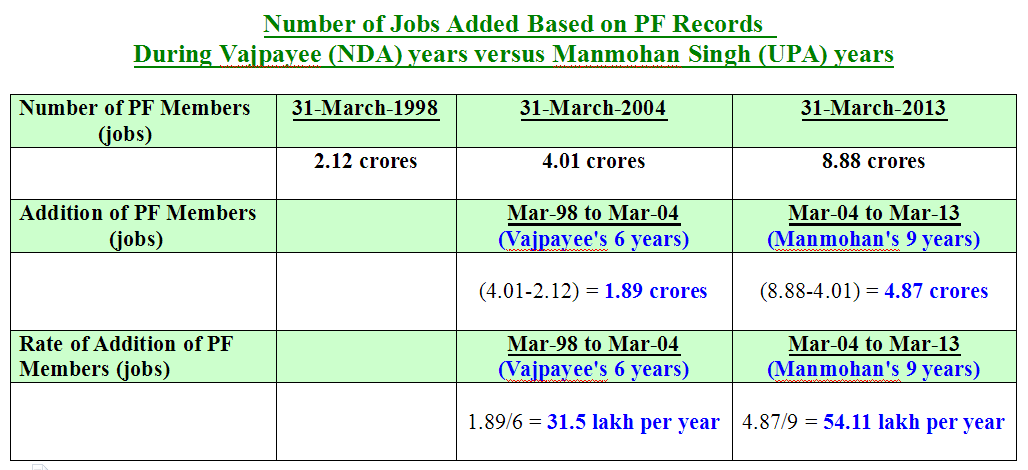
So how about we look at what the Provident Fund Numbers story tells us, about the jobs created in India? We'll check the annual reports published by EPFO to see how many jobs got created between Mar-1998 to Mar-2004 (the six years when Vajpayee was in power, and who claims to have created 60 million = 6 crore jobs), and how many between Mar-2004 to Mar-2013 (the nine years of UPA rule, during which the BJP alleges it has created only 2.7 million = 27 lakh jobs). The annual report for the year 2014 is not yet uploaded.
Number of PF members in March-2013:
887.62 lakh = 8.8762 crores = 88.76 million jobs
Number of PF members in March-2004:


Therefore, what does the evidence in the form of Number of Provident Fund Members tell us about job creation in the NDA years versus UPA years...?
So, Messrs Sinha, Prasad and Goyal, if Vajpayee created 60 million jobs, how come only 18.9 million PF members were added during Vajpayee's tenure...? Ah, I see -- not every "jobholder" is obliged to have a PF account -- only those working in organizations with 20+ employees are! I think that explains. But, again, Messrs Sinha, Prasad and Goyal -- if the UPA added only 2.7 million jobs, how come the PF records show that 48.7 million PF members were added during Manmohan Singh's tenure...?
Is there more to the "sixty million NDA jobs table" (Fig 3) than meets the eye?
We saw above that the Planning Commission data showed that in 2004 the workforce size was 457.46 million, which barely increased to 460.22 million in 2010 -- a mere 2.76 million increase, which is what the BJP claims as 'UPA added only 2.7 million jobs in nine years". Let's see what the same document (The Twelfth Five Year Plan - Part 3) which contains the above table also has to say.

Hot Air Balloon Number 3:
NDA created 60 million jobs, while UPA created just 2.7 million
As usual, let's begin with a survey of some of the claims made by some Modi luminaries.
What do Modi's men like to claim...?
Here's the BJP's ex-Finance-Minister, Mr Yashwant Sinha asserting (on 24-Sep-2013):
Continuing his attack, Sinha pointed out that while the NDA had created 60 million jobs in five years, the UPA had created just 2.7 million jobs in nine years.
Here is BJP Deputy Leader in Rajya Sabha, Mr Ravi Shankar Prasad fulminating (on 30-Mar-2014) that under an economist PM, the UPA has destroyed the entire economy and suggesting that the NDA had created jobs through great management of industrial production and manufacturing:
With the critical state of economy because of gross mismanagement, with industrial production and manufacturing seriously crippled, it is no surprise that the UPA’s record at job creation has been extremely poor,” Mr. Prasad said.(Never mind the contradiction that Mr Yashwant Sinha claims that UPA created 2.7 million jobs in nine years, while his cabinet colleague Mr Prasad claims that it created 15.4 million in eight years! Some slippages of the tongue do happen from time to time, especially among the heavyweights, what say...?)
Citing National Sample Survey Data, he said the NDA created 6.07 crore jobs in its six years. In comparison, in the eight years till 2012, for which data was available, the UPA could manage to create only 1.54 crore jobs.
Here is BJP National Treasurer Piyush Goyal declaring:
Goyal stressed on job creation and said the very fact that the policies of the National Democratic Alliance created 60 million jobs is a testimony of good governance.
Here is BJP national spokesperson, the eminent Mr Prakash Javadekar (we discussed his suggestion of NDA having completed 90% of the Golden Quadrilateral in my previous post) claiming:
"Job creation was at its peak in NDA with 60.1 million jobs generated in its six years in office while UPA has created a meagre 14.6 million jobs in seven years," Javadekar said. Employment rate during NDA rule was 42 per cent which the UPA has brought down to 38.6 per cent. "Earlier, experts used to say that UPA is creating a jobless growth. But as of today it is neither growth nor jobs," Javadekar said.(Disclaimer: I have no idea what Mr Javadekar means by saying that "Employment rate during NDA rule was 42 percent". Does he mean unemployment rate during NDA rule was 58%...??? I guess, he must have acquired this factoid from the genius of Mr Modi himself!
By the way, the great Mr Javadekar also challenged the PM to hold a debate on the economy. With him...? -- I'm sure that must have left Manmohan Singh squirming. Anyway, in the absence of MMS joining the debate, I hope this post will try to fill in on the subject!)
And, last but not the least, here is the official BJP document (dated 25-Feb-2014) on the "golden legacy" of Shri Atal Bihari Vajpayee (remember, he of 50% national highways and "Golden" Quadrilateral fame...?) proclaiming that "Vajpayee created 58 million more jobs than UPA-1". (Don't you find it somewhat surprising that the BJP should try to compare itself with UPA-1, when UPA-2 itself is at the end of its tenure...? But we'll leave that for later...)
BJP Official Leaflet - Vajpayee created 58 million more jobs than UPA-1
Source: BJP Website
(click image to enlarge)
And here is the cake. The newspaper Livemint published a Claim-Check-Narendra-Modi-on-jobs-created-by-NDA-vs-UPA, and gave a decisive verdict that it's true! (Well, decisive PMs deserve decisive verdicts, don't they...?)

What, if any, is the basis of these claims...?
Livemint claim-check on Narendra Modi's Assertion on
Jobs Created by NDA vs UPA
Source: Article on Livemint website
(click image to enlarge)
So? What gives...? Is there any basis to the claims being made...? And what exactly is the real truth behind all the tales being spread...? How can on one hand Barack Obama keep frowning that "all jobs are going to India and China", and on the other hand Mr Modi's luminaries keep crying from rooftops that "there are no jobs under UPA"...? One of the two has got to be lying -- right...? Well, read on to find out.
Well, the basis of these claims is the following table from the Twelfth Five Year Plan section on the Social Sector, which quotes the 66th Survey Report on Employment and Unemployment conducted by the National Sample Survey Organization (NSSO).
Absolute Increase in Employment during
NDA years (1999-2000 to 2004-05) versus UPA years (2004-05 to 2009-10)
Source: Twelfth Five Year Plan Part 3 - Social Sectors (page 160 of the pdf)
(click image to enlarge)
So, there I go...! Didn't I just give the BJP ammunition...? Now all the BJP propagandists, who never knew where those figures of sixty million jobs actually came from, can claim that what they were speaking was nothing but the truth. I have just self-contradicted my own take, and instead added grist to the BJP's mill...! I have just given their claims legitimacy, that they themselves were never quite aware of. Haven't I just proved with official data that the NDA did actually create sixty million jobs...? Or have I...?
Well, the answer is: it's not so simple.
Have you ever heard of a bikini...? You have, right...? I'm sure you have. Have you also heard what they say of a bikini...? -- It hides more than it reveals.
The question that one should first ask is: what qualifies as a job, and how does one count the number of jobs that are present...?
Well, we have all heard of the US publishing "jobs data" on a regular basis (monthly, in fact), and that piece of information is published worldwide and shakes stock markets across the globe. For example, this month's report shows that the US added 192,000 jobs in March 2014 and the unemployment rate was at 6.7%. Let's consider how the US arrives at those figures. Here is what the report by the US Bureau of Labor Statistics shows:
US Jobs Data for March 2014 - 192,000 jobs added
Source: US Bureau of Labor Statistics
(click image to enlarge)
So, how does the US arrive at this figure...? Well, look closely at the image and you'll know. The US does so by looking at "payrolls", that too for non-farm sectors. In the US most payrolls are processed by payroll service bureaus (like ADP), which handle taxes, process paychecks, and feed data back to the Bureau of Labor Statistics, all tied to SSN numbers, which is how they manage to publish monthly how many jobs got added or subtracted.
Well, the US is fortunate to have it all packed up nicely through the SSN. Does India have something that serves an equal purpose...? Well, we don't have an SSN to track job payrolls, but we do have one thing which is close. It's the Provident Fund Number, which every person holding a "job" in any organization employing 20 or more people is mandated by law to possess.
So how about we look at what the Provident Fund Numbers story tells us, about the jobs created in India? We'll check the annual reports published by EPFO to see how many jobs got created between Mar-1998 to Mar-2004 (the six years when Vajpayee was in power, and who claims to have created 60 million = 6 crore jobs), and how many between Mar-2004 to Mar-2013 (the nine years of UPA rule, during which the BJP alleges it has created only 2.7 million = 27 lakh jobs). The annual report for the year 2014 is not yet uploaded.
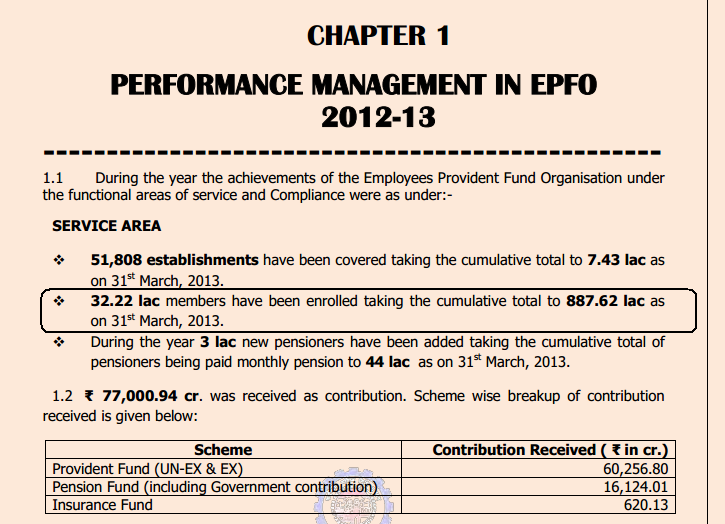
Number of PF members in March-2013:
887.62 lakh = 8.8762 crores = 88.76 million jobs
Number of PF members as on 31-Mar-2013: 8.88 crores
Source: EPFO Annual Report 2012-13 (page 13 of the pdf)
(click image to enlarge)
Number of PF members in March-2004:
400.92 lakhs = 4.0092 crores = 40.1 million jobs
Number of PF members as on 31-Mar-2004: 4.01 crores
Source: EPFO Annual Report 2003-04 (page 9 of the pdf)
(click image to enlarge)
Number of PF members in March-1998:
212.19 lakhs = 2.1219 crores = 21.2 million jobs
Number of PF members as on 31-Mar-1998: 2.12 crores
Source: EPFO Annual Report 1997-98 (page 7 of the pdf)
(click image to enlarge)
Therefore, what does the evidence in the form of Number of Provident Fund Members tell us about job creation in the NDA years versus UPA years...?
Jobs Created During NDA versus UPA years
(click image to enlarge)
So, Messrs Sinha, Prasad and Goyal, if Vajpayee created 60 million jobs, how come only 18.9 million PF members were added during Vajpayee's tenure...? Ah, I see -- not every "jobholder" is obliged to have a PF account -- only those working in organizations with 20+ employees are! I think that explains. But, again, Messrs Sinha, Prasad and Goyal -- if the UPA added only 2.7 million jobs, how come the PF records show that 48.7 million PF members were added during Manmohan Singh's tenure...?
Is there more to the "sixty million NDA jobs table" (Fig 3) than meets the eye?
We saw above that the Planning Commission data showed that in 2004 the workforce size was 457.46 million, which barely increased to 460.22 million in 2010 -- a mere 2.76 million increase, which is what the BJP claims as 'UPA added only 2.7 million jobs in nine years". Let's see what the same document (The Twelfth Five Year Plan - Part 3) which contains the above table also has to say.
Unemployment Rate During NDA Years Versus UPA Years
(click image to enlarge)
What does the table show...? The unemployment rate during 2004-05 was 8.2%, which came down to 6.6% in the year 2009-10. In fact, Vajpayee increased the unemployment rate from 7.31% in 1999 when he took over to 8.2% when he left in 2004. Therefore, in the same period in which Vajpayee claims to have added 60 million jobs, he also increased the unemployment rate from 7.31% to 8.2%. Astonishing, isn't it...? How does this compute...?
Well, the answer is simple. During NDA period, the "number of jobs" increased but an even greater number of people had to look for employment. Therefore, the effective unemployment rate increased to 8.2%. Whereas, during the UPA years the "number of jobs" didn't increase much, but there were more number of people who no longer needed to seek employment. Therefore, the effective unemployment rate decreased to 6.6%.
And why would that happen...?
Again, look at the table closely. During the NDA years (1999 to 2004) the wages for a rural worker increased from Rs 127.32 to Rs 144.93, a mere 13.83% increase in 5 years. Whereas, during the UPA years (2004 to 2010), the wages for the same rural worker increased from Rs 144.93 to Rs 249.15, a staggering 71.91% increase in 6 years.
Therefore, because of UPA policies, each worker was earning almost the same as two workers during NDA times. Is it any wonder that the number of people who needed to seek employment drastically reduced...? The maximum reduction was seen in rural women who now no longer needed to be farm laborers because their husband's income alone could suffice for their family's survival. The BJP paints this as "UPA destroyed employment opportunities for women". And, similarly, there was a large reduction in child laborers too in farm sector -- "jobholder" children who were sent by the UPA to where they belonged -- in schools!
Therefore, because of UPA policies, each worker was earning almost the same as two workers during NDA times. Is it any wonder that the number of people who needed to seek employment drastically reduced...? The maximum reduction was seen in rural women who now no longer needed to be farm laborers because their husband's income alone could suffice for their family's survival. The BJP paints this as "UPA destroyed employment opportunities for women". And, similarly, there was a large reduction in child laborers too in farm sector -- "jobholder" children who were sent by the UPA to where they belonged -- in schools!
Let's look at the percentage of child laborers in the workforce during NDA years versus UPA years.


Child Workforce Participation Rate during NDA versus UPA Years
Source: 12th Five Year Plan - Part 3 - Social Sectors (page 133 of the pdf)
(click image to enlarge)
Definition of Child Labour
(click image to expand)
What does it show...? The percentage of child laborers during NDA years was 3.3% of the workforce. The size of the workforce being 457.46 million, this amounts to 457.46*3.3/100 = 15.09 million child laborers. The percentage of child laborers during UPA years was 2.0% of the workforce. The size of the workforce being 460.22 million, this amounts to 460.22*2.0/100 = 9.2 million child laborers. The UPA (by 2010) had sent almost six million children who were child laborers under Vajpayee away from the workforce to school. If you believe Mr Modi, this amounts to loss of six million jobs (because these six million too were present in their count of sixty million jobs)!
Number of Jobs versus Number of Students versus Productivity
Number of Jobs versus Number of Students versus Productivity
This is what Professor J. J. Thomas who teaches Economics at IIT-Delhi and is a fellow of the Indian Council of Social Science Research wrote about the above phenomenon in the Economic and Political Weekly in a paper called The Demographic Challenge and Employment Growth in India:
We looked at the jobs data of 2009-10 from the 12th Five Year Plan, which had quoted the NSSO Unemployment Report - 66th round. Let's also look at the later survey by NSSO in the 68th Round, to find the jobs situation as it existed two years later in 2011-12.

(click image to enlarge)
As can be clearly seen, there was a net increase in employment of 14.7 million (= 1.47 crore), between 2004-05 and 2011-12. This is what Modi's men quote when they like to be more generous, and give the UPA credit for creating 14.6 million jobs (see Javadekar's quote in the beginning).
Read the table more closely, and you'll find that this 14.7 million net increase in employment is after a decrease of 33.3 million in "agricultural and allied activities", while the total increase in non-agricultural jobs is 48.0 million. This is entirely in keeping with any developing economy -- which is known to shed farm jobs and creates employment opportunities elsewhere.
Please note the eerie closeness of this number with the net increase in PF account numbers that I showed above through independent source of data (EPFO Annual Reports). The increase in PF accounts from 2004-2013 was 48.7 million. The only difference is that the above table refers to 48 million non-farm jobs created until 2012, and the PF data showed increase of 48.7 million by Mar-2013.
Also, let's look at what the NSSO-68th Round data shows about net change in participation of rural females (RF) in the labour force, and of increase in the proportion of students in the 15-29 age group:

Net Increase in Jobs from 2004-05 to 2011-12
(click image to enlarge)
As can be clearly seen, there was a net increase in employment of 14.7 million (= 1.47 crore), between 2004-05 and 2011-12. This is what Modi's men quote when they like to be more generous, and give the UPA credit for creating 14.6 million jobs (see Javadekar's quote in the beginning).
Read the table more closely, and you'll find that this 14.7 million net increase in employment is after a decrease of 33.3 million in "agricultural and allied activities", while the total increase in non-agricultural jobs is 48.0 million. This is entirely in keeping with any developing economy -- which is known to shed farm jobs and creates employment opportunities elsewhere.
Please note the eerie closeness of this number with the net increase in PF account numbers that I showed above through independent source of data (EPFO Annual Reports). The increase in PF accounts from 2004-2013 was 48.7 million. The only difference is that the above table refers to 48 million non-farm jobs created until 2012, and the PF data showed increase of 48.7 million by Mar-2013.
Also, let's look at what the NSSO-68th Round data shows about net change in participation of rural females (RF) in the labour force, and of increase in the proportion of students in the 15-29 age group:
Net Increase in Rural Females in Workforce, and Net Increase in Proportion of Students during NDA versus UPA Years
Clearly, what the table shows is that the reduction of the labor force primarily came from rural females (RF). As many as 24.6 million rural females switched from being farm laborers to attending domestic duties. For urban females, there was a 2 million increase in labor force participation. For males, both rural and urban, there was total increase of 32.6 million.
What is more significant is the increase in the number of students, that too at the rural level. 16.4 million rural males took up studies and so did 12 million rural females. These numbers are double than their urban counterparts, which is a clear indication of prosperity finally reaching the rural hinterland. This is the way to improve labor productivity through workforce skilling. The UPA's policies of increasing education expenditure almost five fold, and prioritized focus on rural development and health, has had a direct bearing on increasing productivity, as can be seen in the following tables:


Education Outlay Almost 20% of Gross Budgetary Support in 11th Plan
Clearly, labor productivity growth has doubled in the 2005-2010 period, compared to the 2000-2005 period, and has significantly narrowed the gap with China, which is clear indicator of a more skilled workforce, working in tandem with higher mechanization. And that's the driver for the boom in GDP growth despite fewer jobs. Any CEO who can show this report card gets toasted by the stock markets. Unless, of course, his name Manmohan Singh, in which case he gets reviled...!
Gujarat Model of Job Creation:
Before concluding, let's take a look at what the PF data shows about the much famed job creation in Gujarat between 1998 and 2013.
State-wise distribution of PF members in 1998:
Maharashtra on top with 17%, Bengal third with 10.11%, Gujarat sixth with 6.88%, Haryana fifteenth with 2.52%

State-wise distribution of PF members in 2004:
What we see is that Gujarat went from having 6.88% of the jobs in 1998, to 8.99% of jobs in 2004. After that, with the famed 'Modi Effect' on job creation, its share has fallen to 8.65% in 2013.
In the same period, Haryana rose from fifteenth position with 2.52% of all jobs in 1998, to fifth with 6.28% of all jobs in 2013. Tamil Nadu rose one place from second in 1998 with 15.28% of all jobs to the top of the table with 17.65% in 2013. And Bengal declined from third (10.11% of all jobs) in 1998 to ninth (with 4.24% of all jobs) in 2013.
Numbers can tell the story on their own...!
Ignoring PF numbers, and counting all unorganized sector and farm labor, NDA added 60 million in six years. UPA added 48 million non-farm jobs in eight years up to 2012, with a reduction of 33.3 million farm laborers (24.6 million of which rural females, who moved to domestic duties), to have a net addition of 14.7 million jobs until 2012.
The top three states for "real jobs" are Tamil Nadu (17.65%), Maharashtra (16.86%) and Karnataka (with 14.04%), which together make up for almost half of India's 8.88 crore "real jobs". Gujarat comes only fourth accounting for 8.65% of all "real jobs", and has in fact seen its share of jobs slip from 8.99% in 2004.
Therefore, if you are a young, educated Indian looking for a job that at least would have a Provident Fund Number with it, the UPA is the government of choice for you. They created almost five crores of those in nine years, compared to the less than 2 crores that the NDA did in six years. And maximize your chances of landing a job by heading towards either Tamil Nadu, Maharashtra or Karnataka each of which has about double the number of jobs as Gujarat does. However, if what you are looking for is a poorly paying farm-laborer job, bereft of any social security benefits (and especially of female/child laborer variety), then you'd do much better harking back to the NDA era...!
The following graphic from the March-2014 issue of Economy Matters published by the Confederation of Indian Industry(CII) too corroborates what I showed above -- that UPA created over 5 crore non-agricultural jobs, in industry and services:

What is more significant is the increase in the number of students, that too at the rural level. 16.4 million rural males took up studies and so did 12 million rural females. These numbers are double than their urban counterparts, which is a clear indication of prosperity finally reaching the rural hinterland. This is the way to improve labor productivity through workforce skilling. The UPA's policies of increasing education expenditure almost five fold, and prioritized focus on rural development and health, has had a direct bearing on increasing productivity, as can be seen in the following tables:
Five-fold Jump in Education Outlay During UPA 1
(click image to enlarge)
(click image to enlarge)
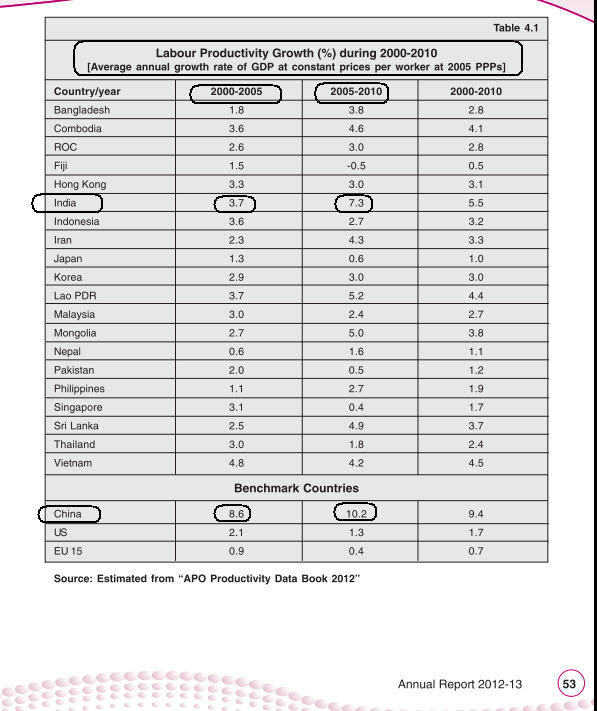
Labor Productivity Growth from 2005-2010
Source: Labor Ministry Annual Report 2012-13 (page 53)
(click image to enlarge)
Clearly, labor productivity growth has doubled in the 2005-2010 period, compared to the 2000-2005 period, and has significantly narrowed the gap with China, which is clear indicator of a more skilled workforce, working in tandem with higher mechanization. And that's the driver for the boom in GDP growth despite fewer jobs. Any CEO who can show this report card gets toasted by the stock markets. Unless, of course, his name Manmohan Singh, in which case he gets reviled...!
Gujarat Model of Job Creation:
Before concluding, let's take a look at what the PF data shows about the much famed job creation in Gujarat between 1998 and 2013.
State-wise distribution of PF members in 1998:
Maharashtra on top with 17%, Bengal third with 10.11%, Gujarat sixth with 6.88%, Haryana fifteenth with 2.52%
PF Membership by State in Mar-1998
Source: EPFO Annual Report 1997-98 (page 25 of doc)
(click image to enlarge)
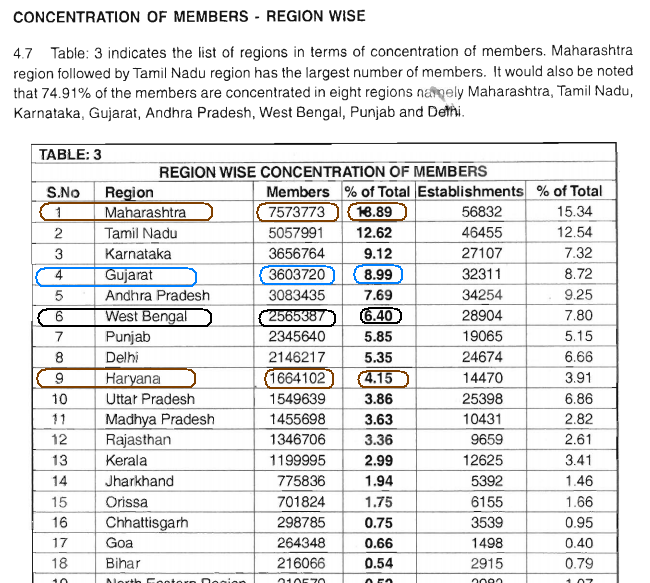
State-wise distribution of PF members in 2004:
Maharashtra on top with 16.89%, Gujarat fourth with 8.99%, Bengal sixth with 6.40%, Haryana ninth with 4.15%
PF Membership by State in Mar-2004
Source: EPFO Annual Report 2003-04(page 24 of doc)
(click image to enlarge)
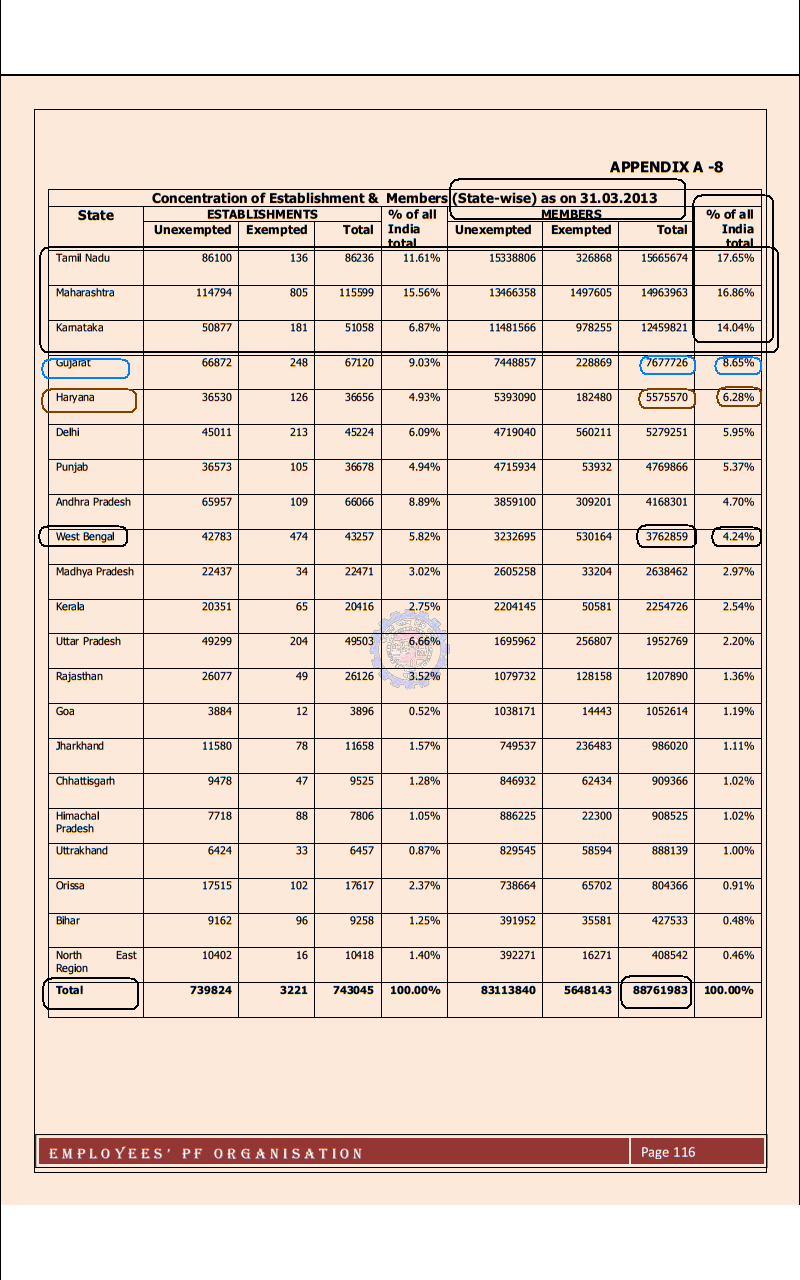
State-wise distribution of PF members in 2013:
Tamil Nadu on top with 17.65%, Maharashtra second with 16.86%, Gujarat fourth with 8.65%, Haryana fifth with 6.28%, Bengal ninth with 4.24%
PF Membership by State in Mar-2013
Source: EPFO Annual Report 2012-13(page 116 of doc)
(click image to enlarge)
What we see is that Gujarat went from having 6.88% of the jobs in 1998, to 8.99% of jobs in 2004. After that, with the famed 'Modi Effect' on job creation, its share has fallen to 8.65% in 2013.
In the same period, Haryana rose from fifteenth position with 2.52% of all jobs in 1998, to fifth with 6.28% of all jobs in 2013. Tamil Nadu rose one place from second in 1998 with 15.28% of all jobs to the top of the table with 17.65% in 2013. And Bengal declined from third (10.11% of all jobs) in 1998 to ninth (with 4.24% of all jobs) in 2013.
Numbers can tell the story on their own...!
Conclusion:
If you consider having a Provident Fund Number as proof of job-holding, the NDA created 18.9 million (=1.89 crore) jobs in six years at the rate of 3.15 million per year. UPA created 48.7 million (=4.87 crore) jobs in its nine years upto March-2013, at a rate of 5.41 million per year.
If you consider having a Provident Fund Number as proof of job-holding, the NDA created 18.9 million (=1.89 crore) jobs in six years at the rate of 3.15 million per year. UPA created 48.7 million (=4.87 crore) jobs in its nine years upto March-2013, at a rate of 5.41 million per year.
Ignoring PF numbers, and counting all unorganized sector and farm labor, NDA added 60 million in six years. UPA added 48 million non-farm jobs in eight years up to 2012, with a reduction of 33.3 million farm laborers (24.6 million of which rural females, who moved to domestic duties), to have a net addition of 14.7 million jobs until 2012.
The top three states for "real jobs" are Tamil Nadu (17.65%), Maharashtra (16.86%) and Karnataka (with 14.04%), which together make up for almost half of India's 8.88 crore "real jobs". Gujarat comes only fourth accounting for 8.65% of all "real jobs", and has in fact seen its share of jobs slip from 8.99% in 2004.
Therefore, if you are a young, educated Indian looking for a job that at least would have a Provident Fund Number with it, the UPA is the government of choice for you. They created almost five crores of those in nine years, compared to the less than 2 crores that the NDA did in six years. And maximize your chances of landing a job by heading towards either Tamil Nadu, Maharashtra or Karnataka each of which has about double the number of jobs as Gujarat does. However, if what you are looking for is a poorly paying farm-laborer job, bereft of any social security benefits (and especially of female/child laborer variety), then you'd do much better harking back to the NDA era...!
The following graphic from the March-2014 issue of Economy Matters published by the Confederation of Indian Industry(CII) too corroborates what I showed above -- that UPA created over 5 crore non-agricultural jobs, in industry and services:
Confederation of Indian Industry (CII) Report on Employment
(click image to enlarge)
No comments:
Post a Comment